Views / Charts
![]() The Views/Charts panel of Publish Data in Production Things and Controllers, and the Data Views tab in Published Data allow the visualization of the data being
published using one of the following options:
The Views/Charts panel of Publish Data in Production Things and Controllers, and the Data Views tab in Published Data allow the visualization of the data being
published using one of the following options:
- Line or bar charts which graph values on the vertical (y) axis and time on the horizontal (x) axis.
- Gauges which display the last value published in the channel to which the gauge subscribes.
- Maps which are used to display location data published with latitude, longitude coordinates.
The Views/Charts and Data Views panels allow the creation and storage of custom data views that are updated in real time as data is published in the platform. By default, the platform creates and updates line charts when numeric data is published.
To create or save a data view:
- Double click on the row containing the channel for which you want to create a data view.
- Enter a Name for the Data View.
- Select a layout. Multipanel layouts allow you to create multiple views of the data in one or in multiple channels.
- Click on the panel you want to configure and enter the required data:
- Publisher, which can be a Thing, Controller, a device identified by a Plug-ID, any device or Company. The data published by Company is visible to all devices.
- Channel from which the data will be read.
- Data Field if the data is a JSON with data fields
- Title to give a title to your chart
- Select the type of chart which can be a Line, Bar, Gauge or Map chart.
- Enter the starting date for the chart and the period that you want to display. These parameters do not apply to Gauges.
- If you selected a Line chart you can select a color and whether to have a fill or not. Bar charts allow color selection and Map charts only start date and period. Gauges have their own set up.
In addition, the following actions can be made on Data Views:
- The Data View panels can be edited by clicking on the panel’s gear icon.
- Time based charts allow:
- Scrolling over time periods with the forward (>) and backwards (<) arrows.
- Zoom into a period. Simply position your pointer on the desired date and drag a rectangle over the period you want to zoom into. To unzoom click on the (
 ) button.
Here are two examples for creating numeric and location based data views.
Numeric Data Views example
Here is an example that shows the images for:
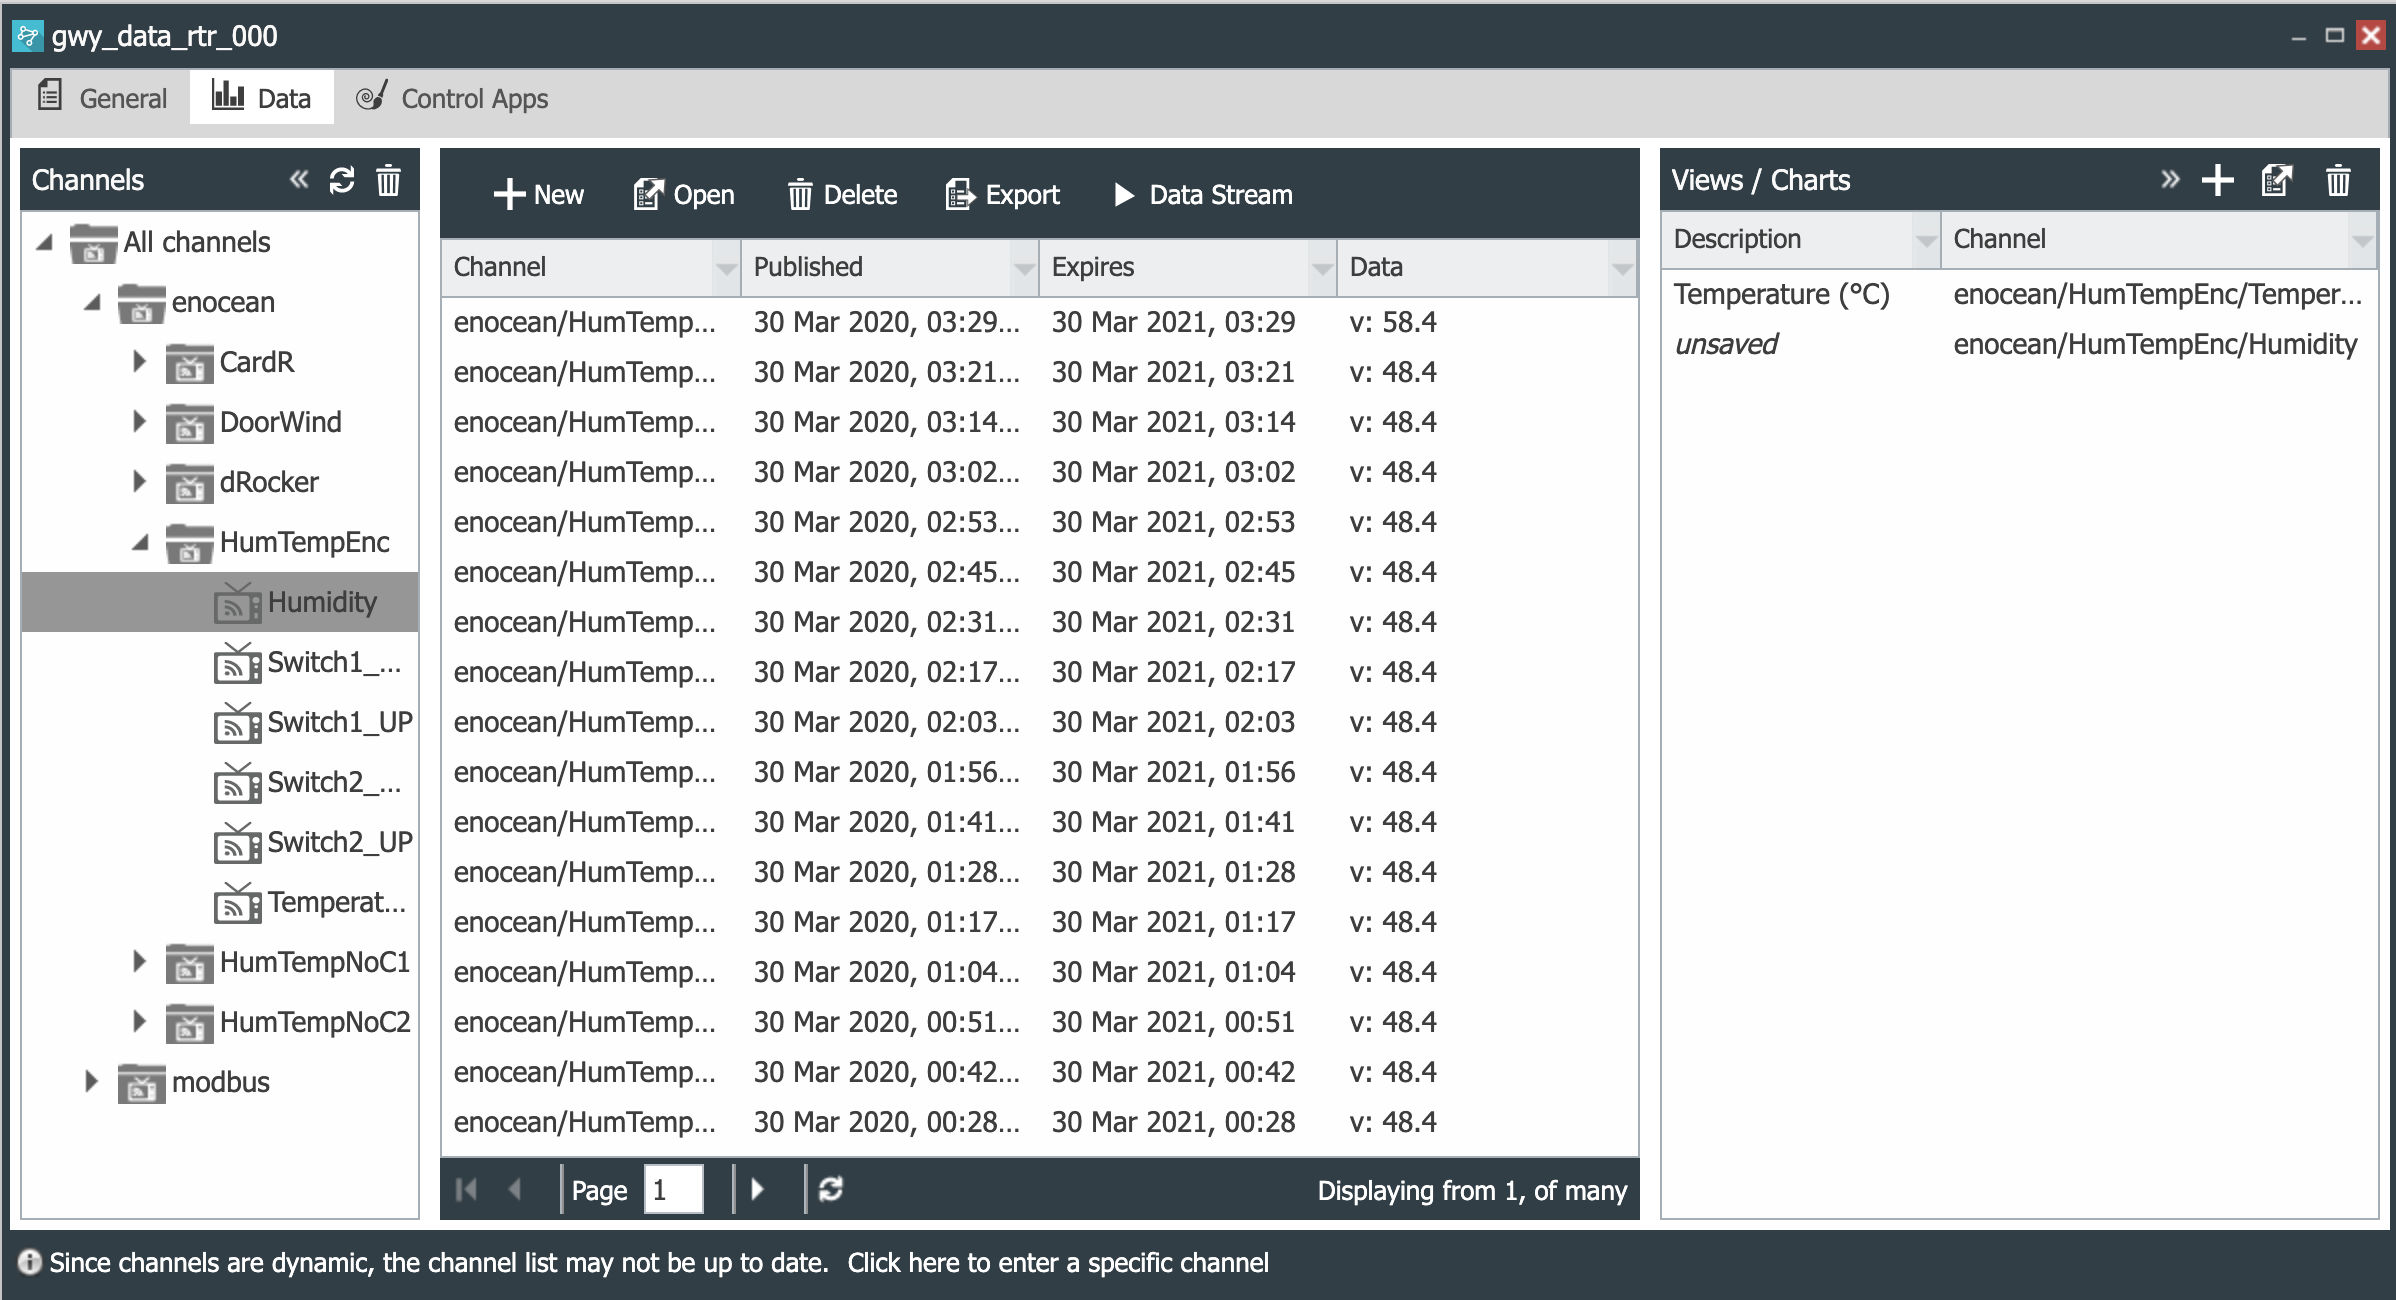
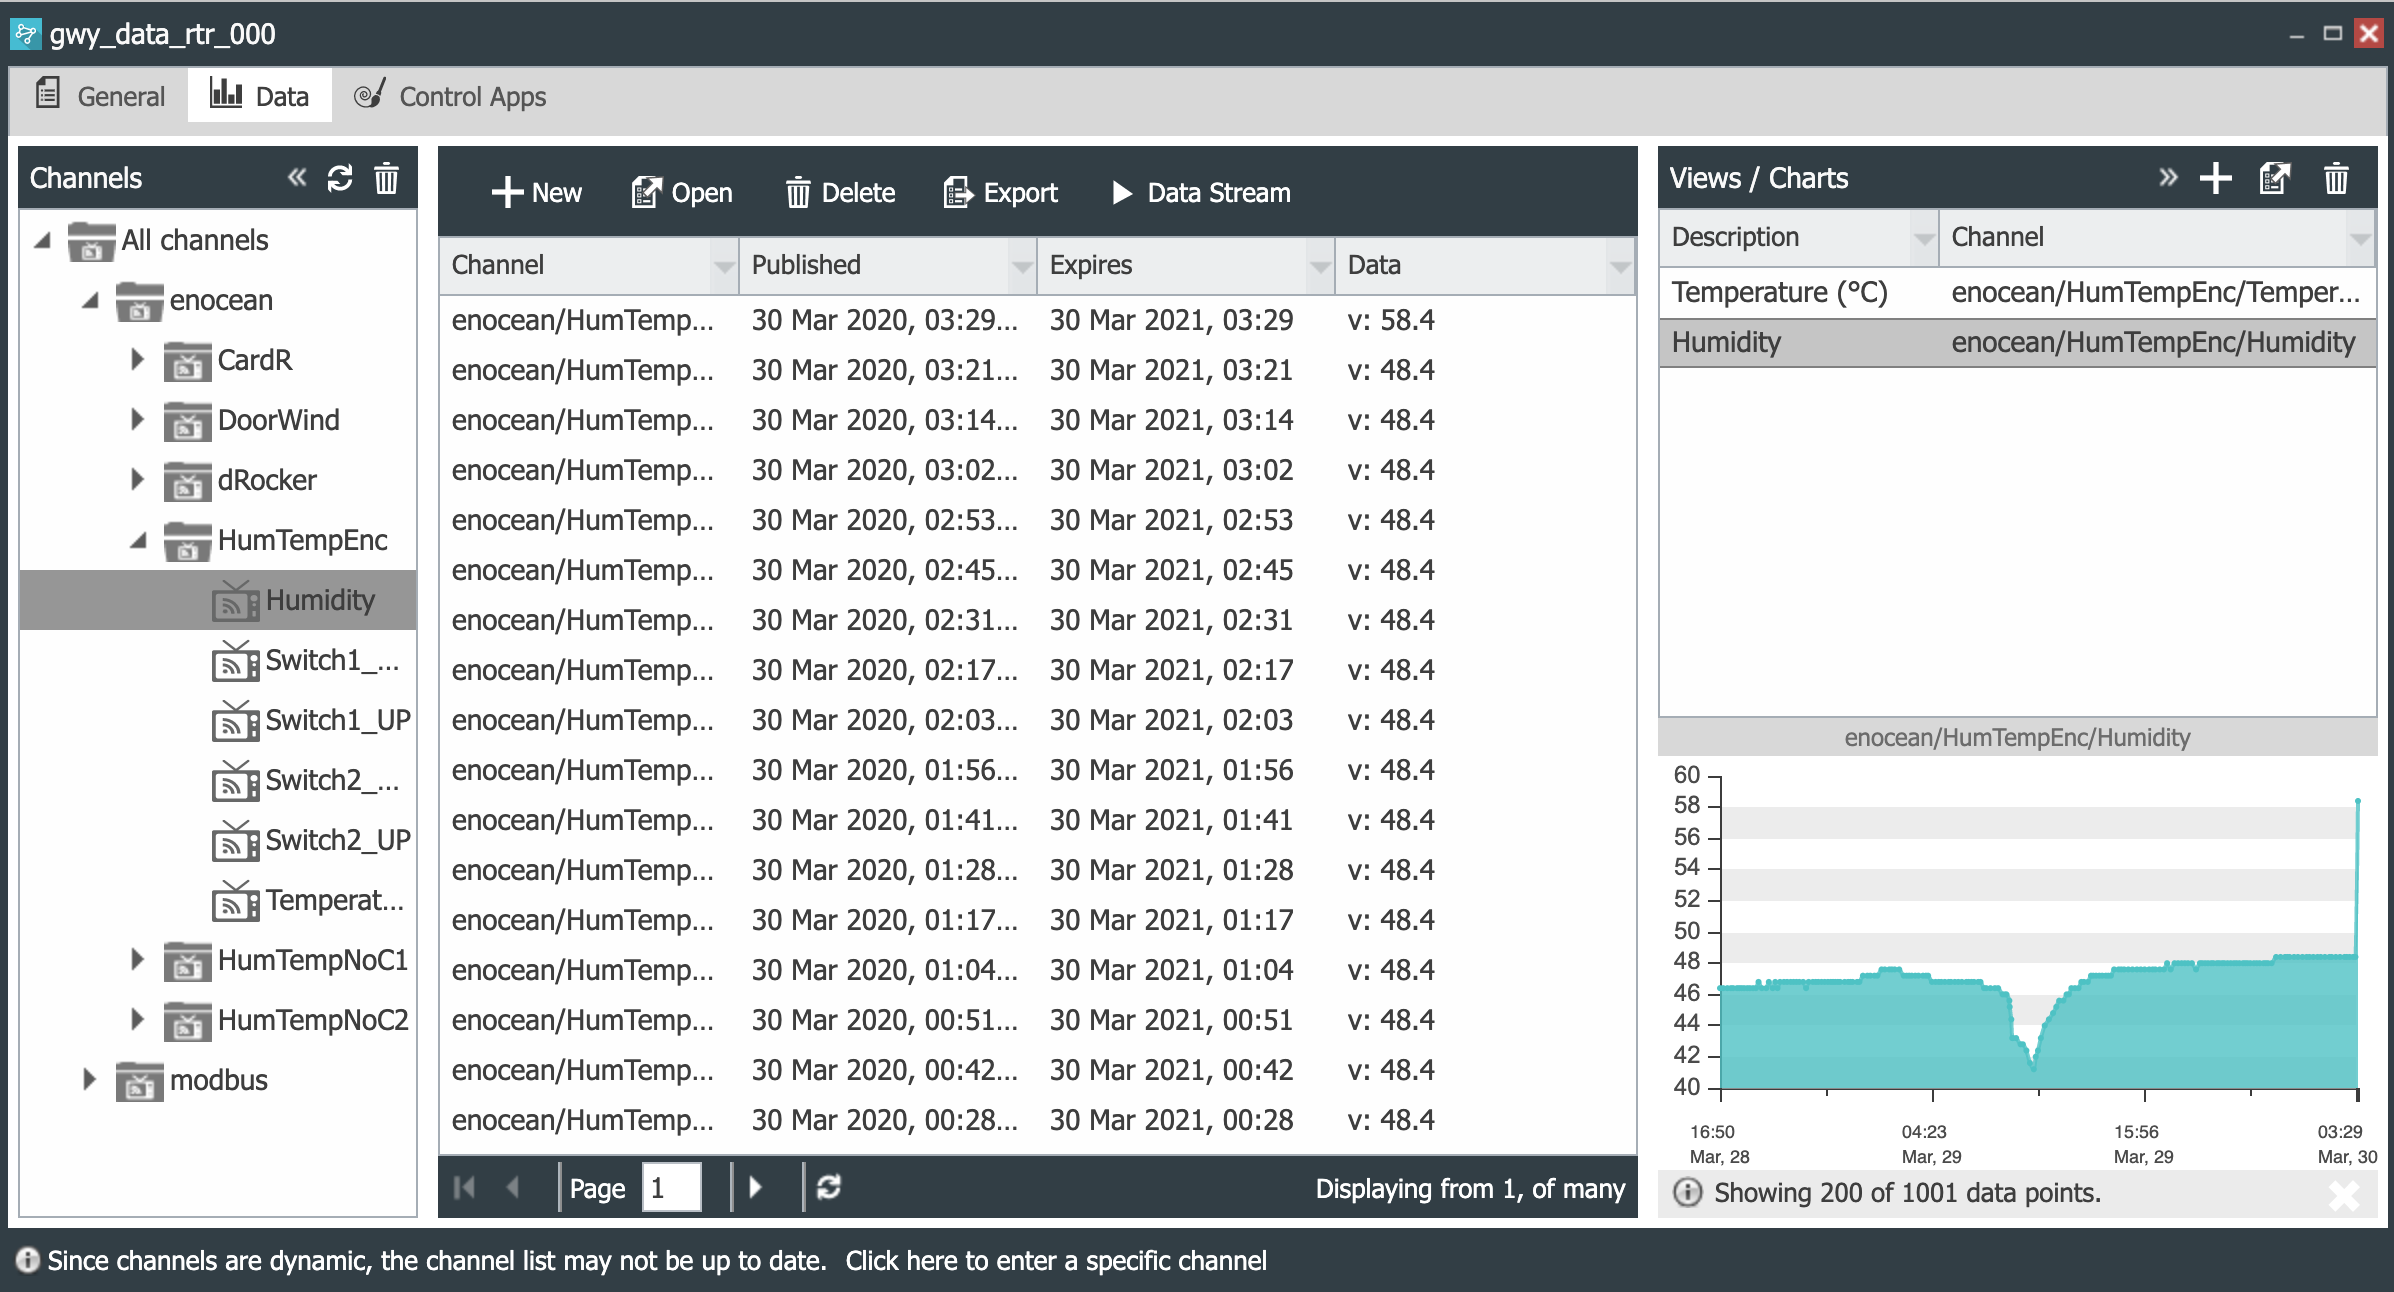
- The published data in a channel
- The baseline and selection of a 2 panel layout.
- The configurations for a line chart in one panel and a gauge in the other panel.
- The resulting Data view.
The channel data used to create the Data View will be enocean/HumTempEnc/Humidity:
 |
|---|
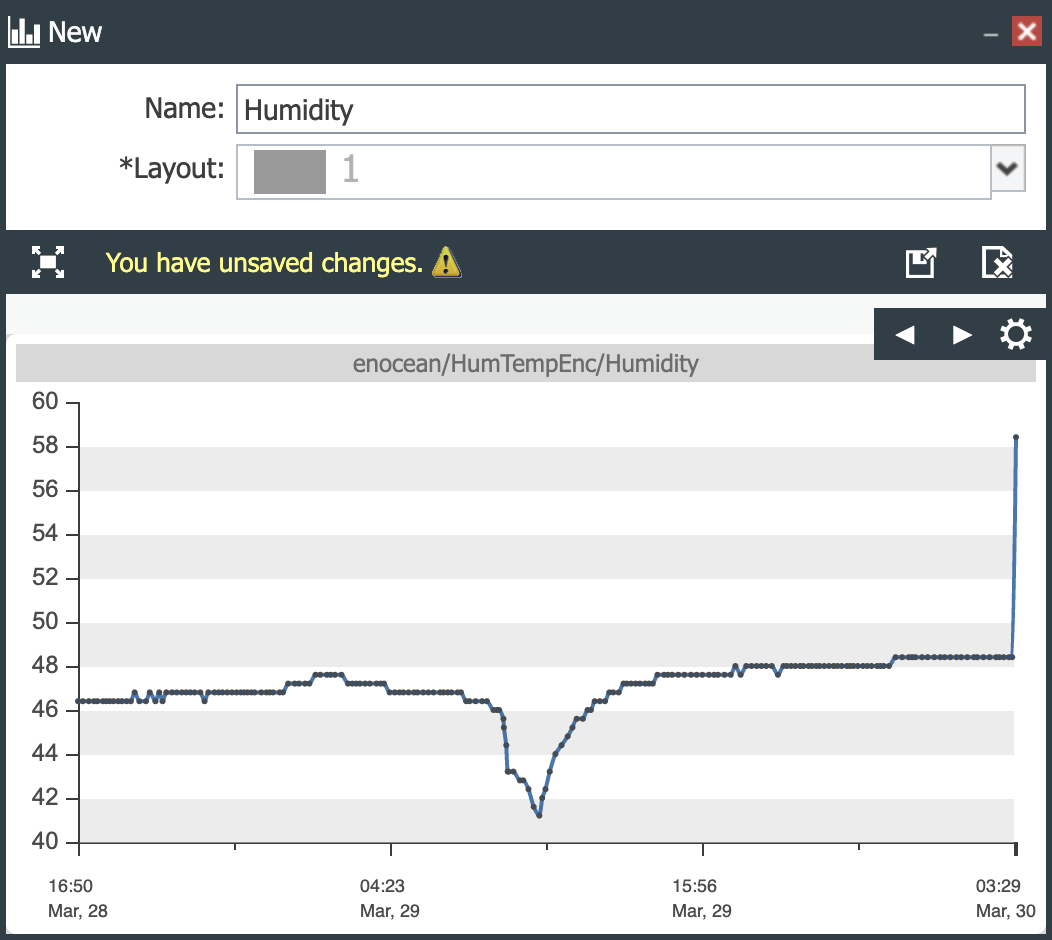
Double clicking on unsaved opens the Data View configuration window. Enter the Name and select a Layout type.
 |
|---|
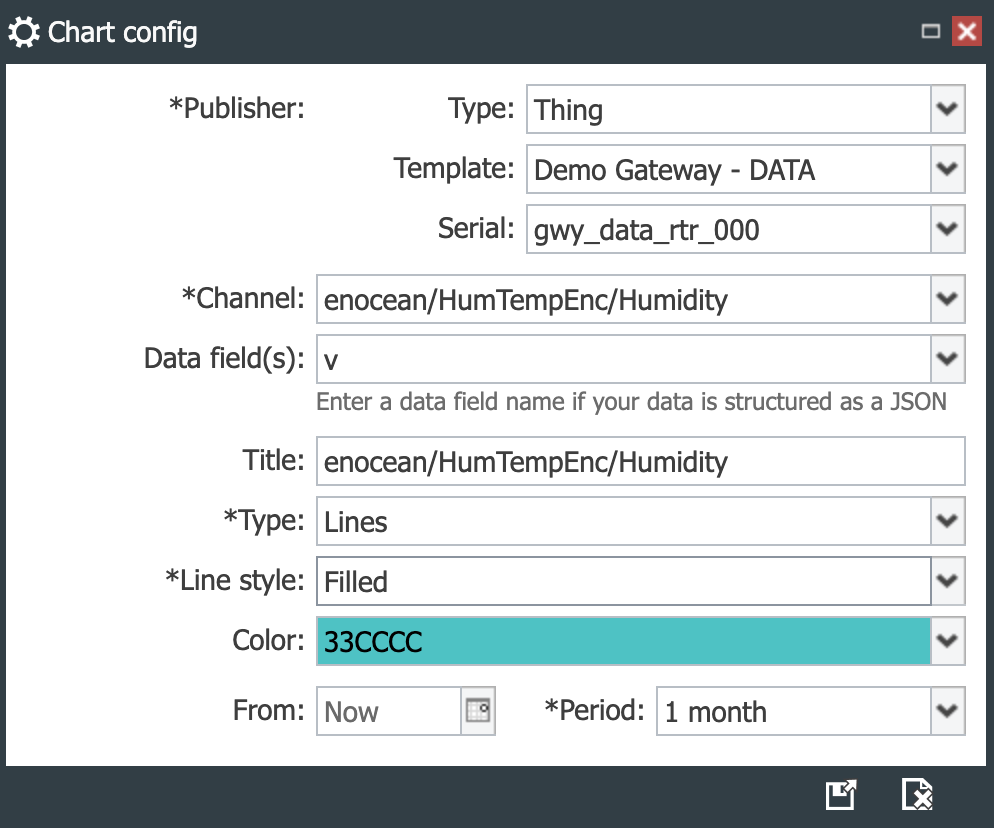
Click on the Configuration Gear to create a new line chart and on the previous line chart’s gear button to create a gauge. The configuration after saving is as follows:
  |
|---|
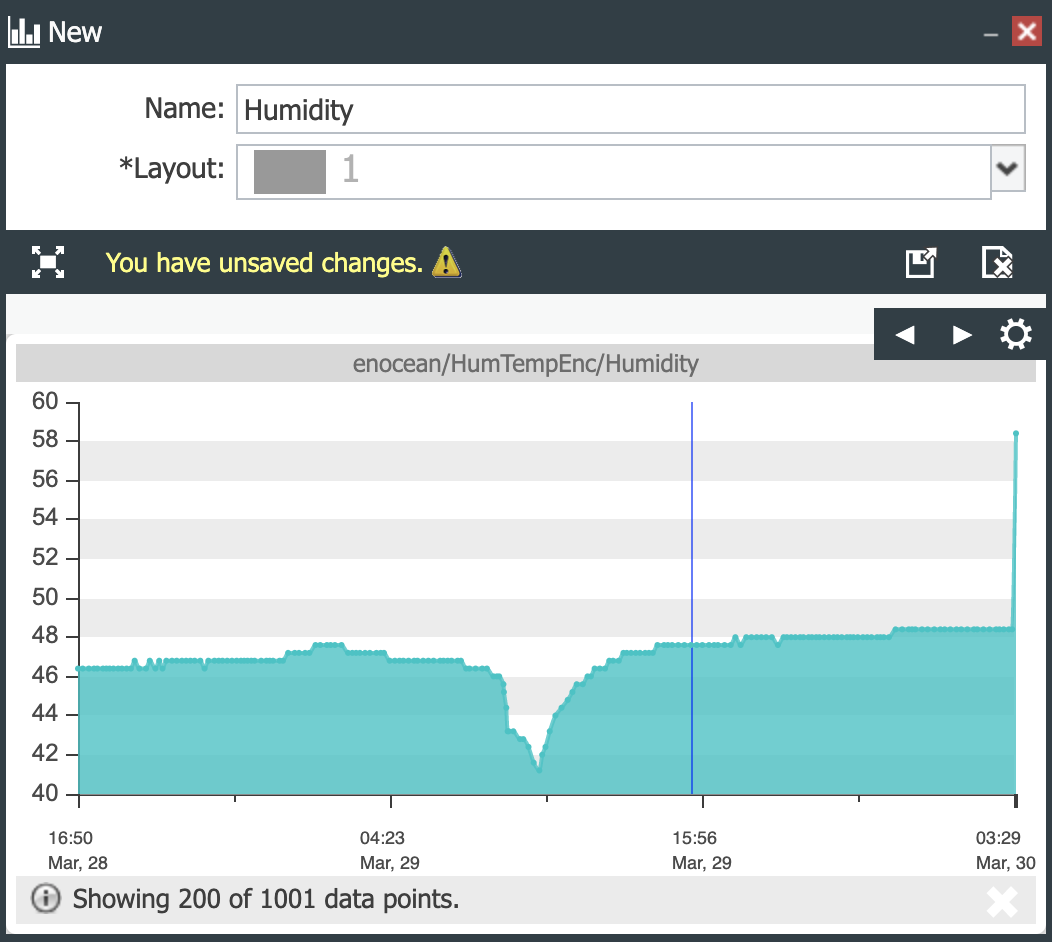
The final Data View:
 |
|---|
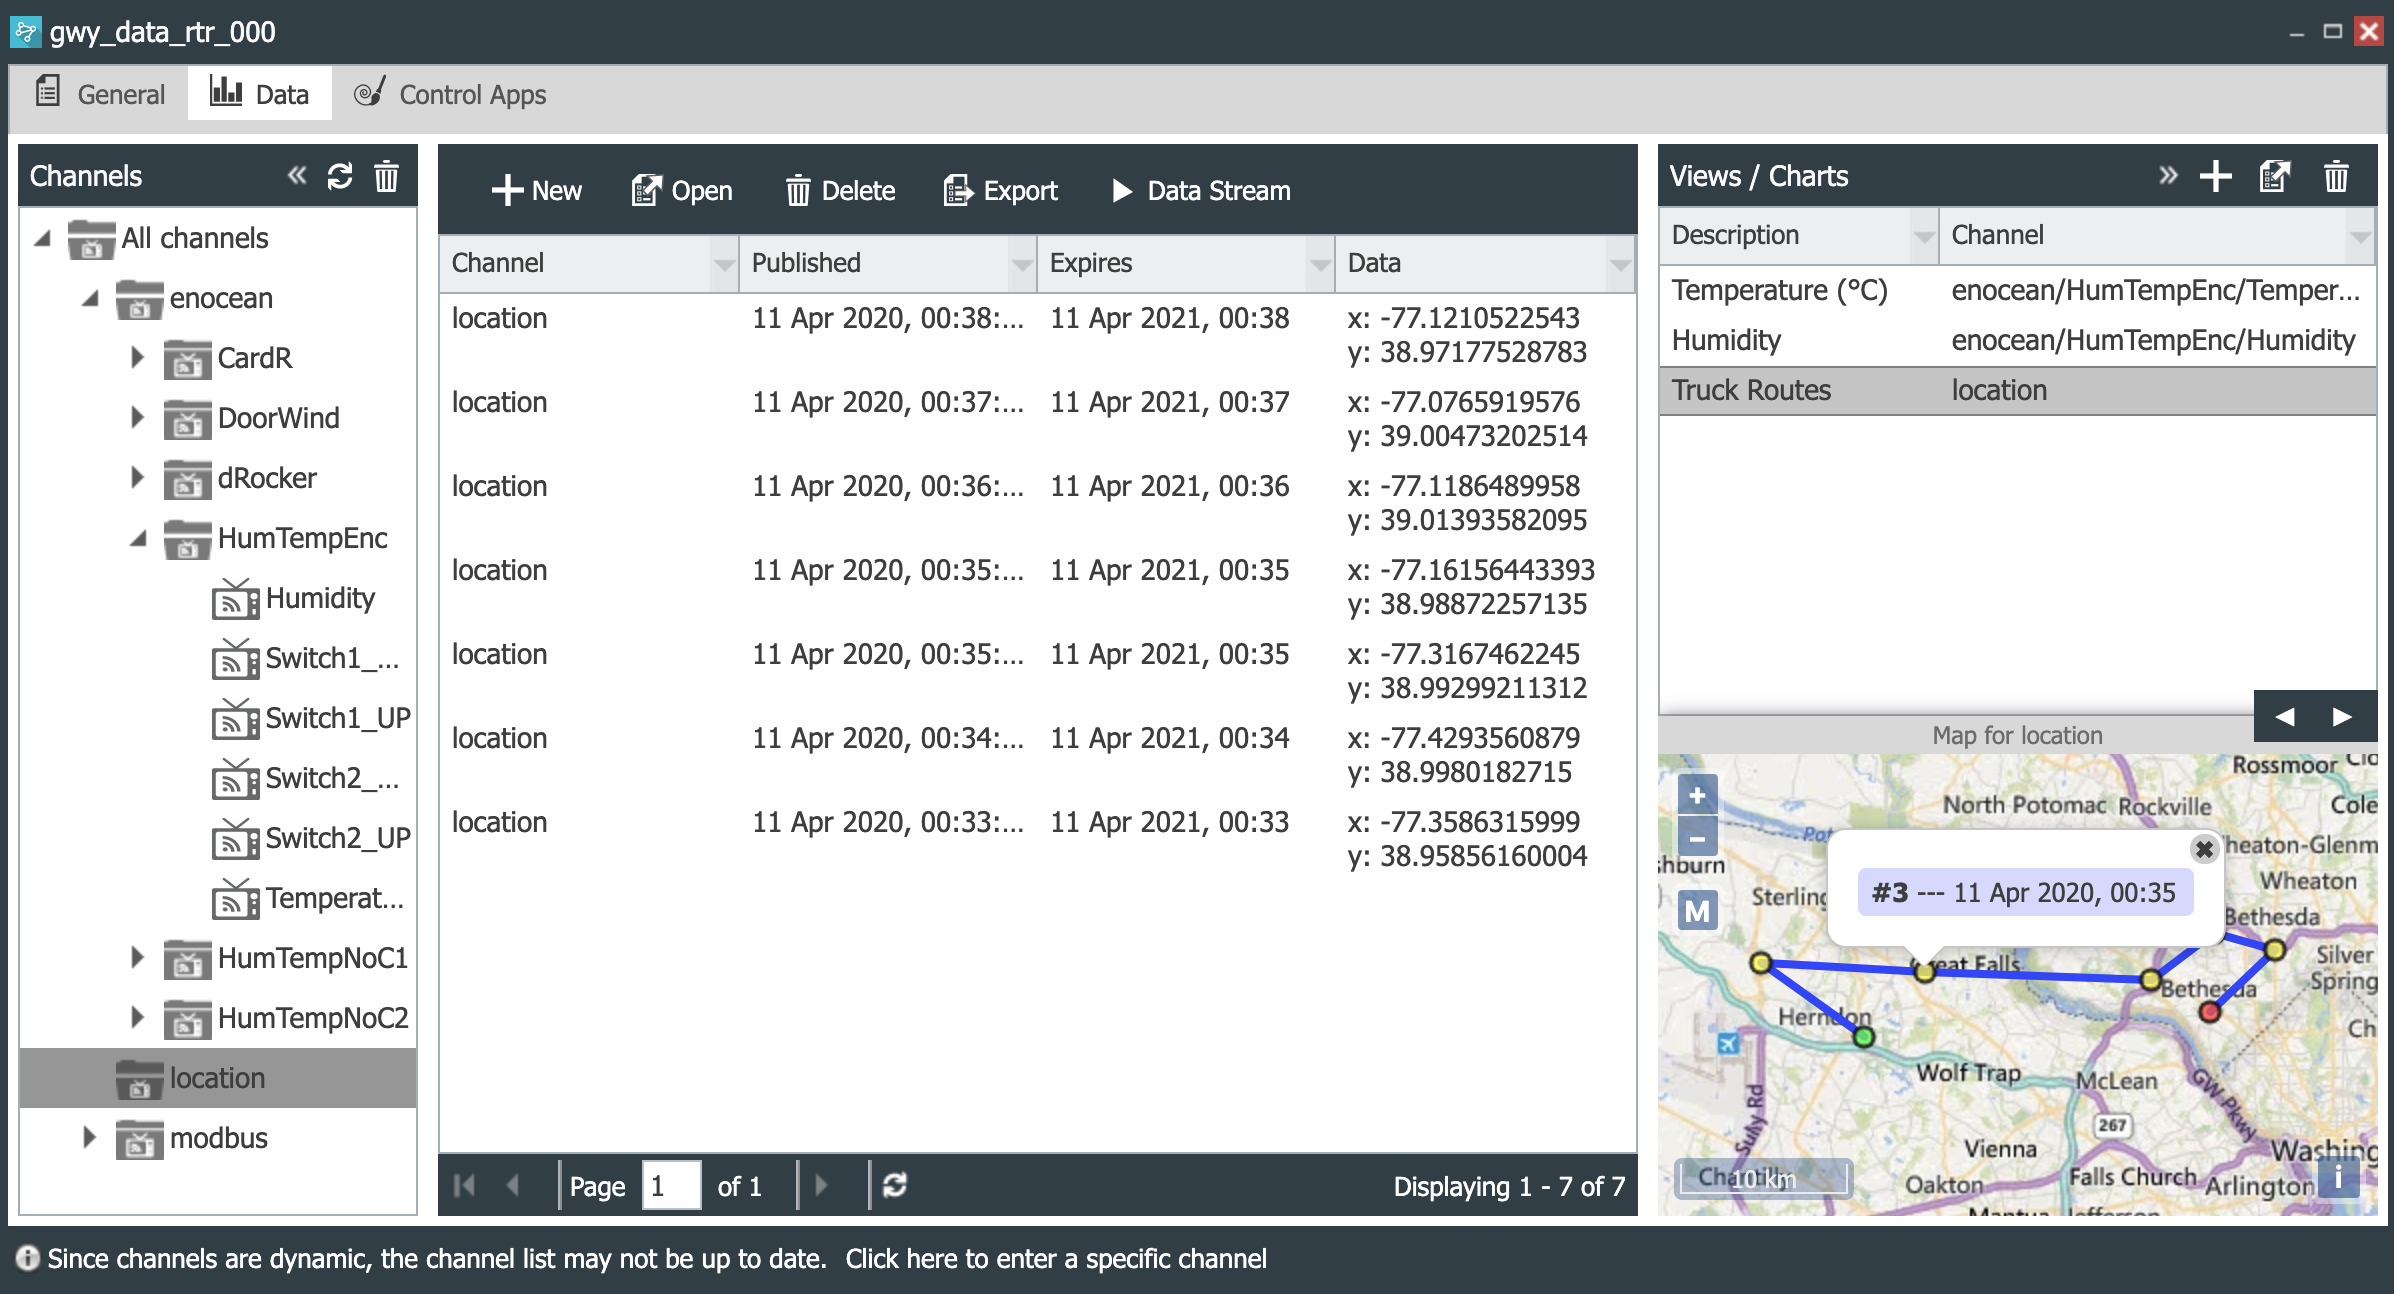
Location Data Views Example
This example shows how to create a data view based on location data of a mobile device.
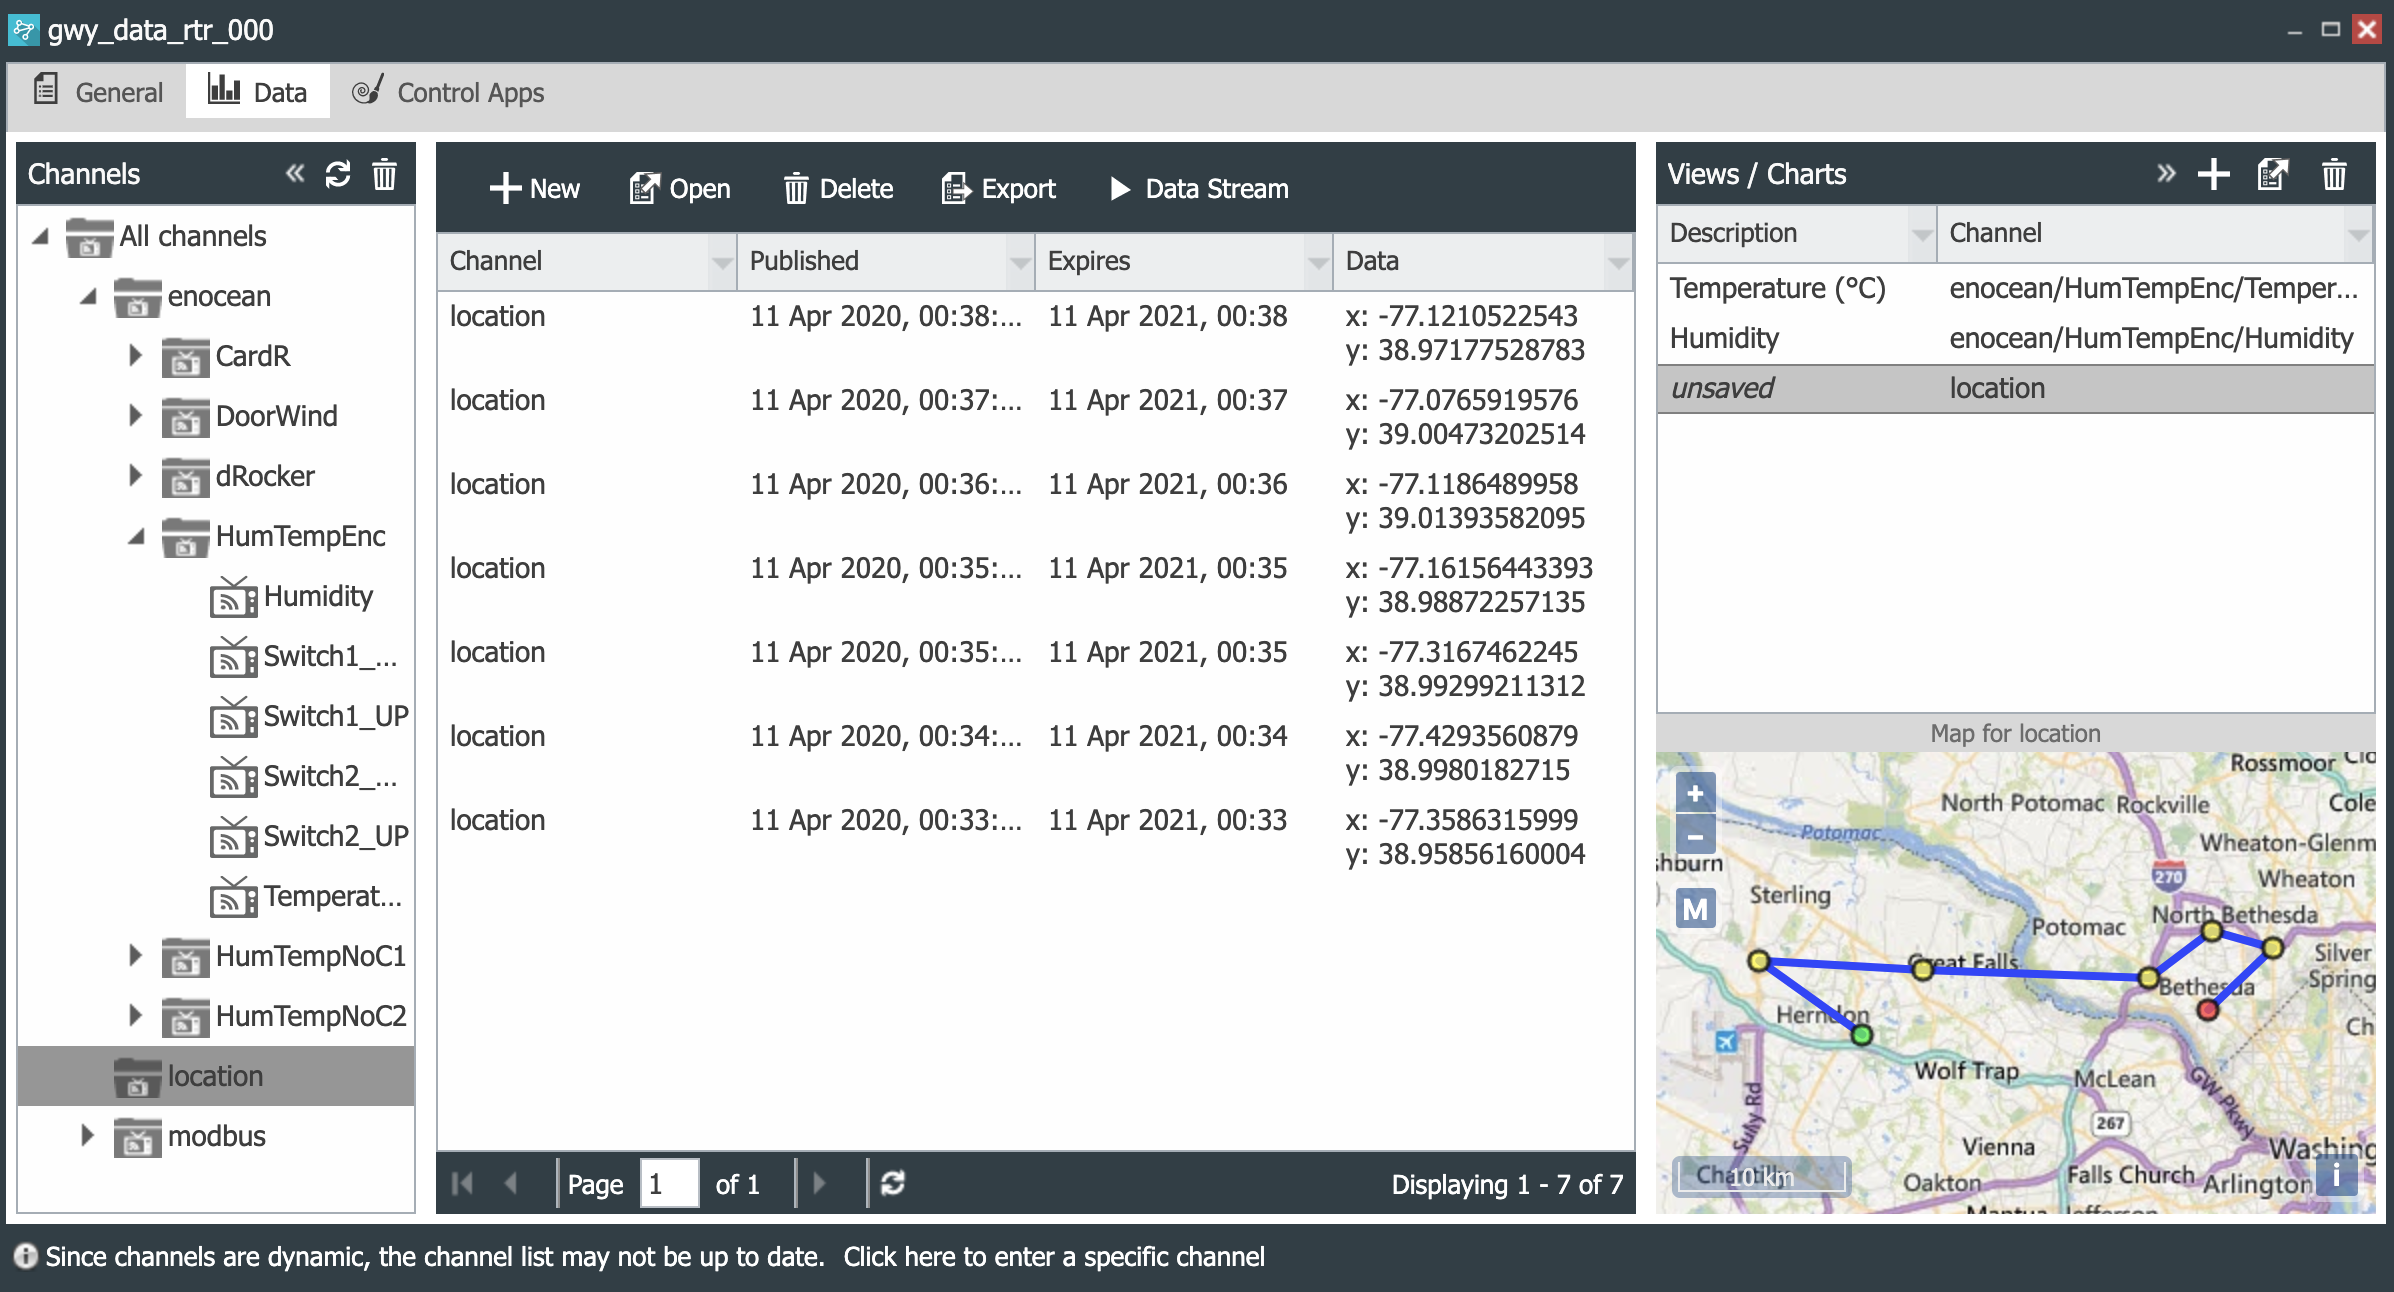
- Publish location data in a channel that we call location as shown below. As the data gets published the trace of movements is shown on the Views / Charts panel.
 |
|---|
-
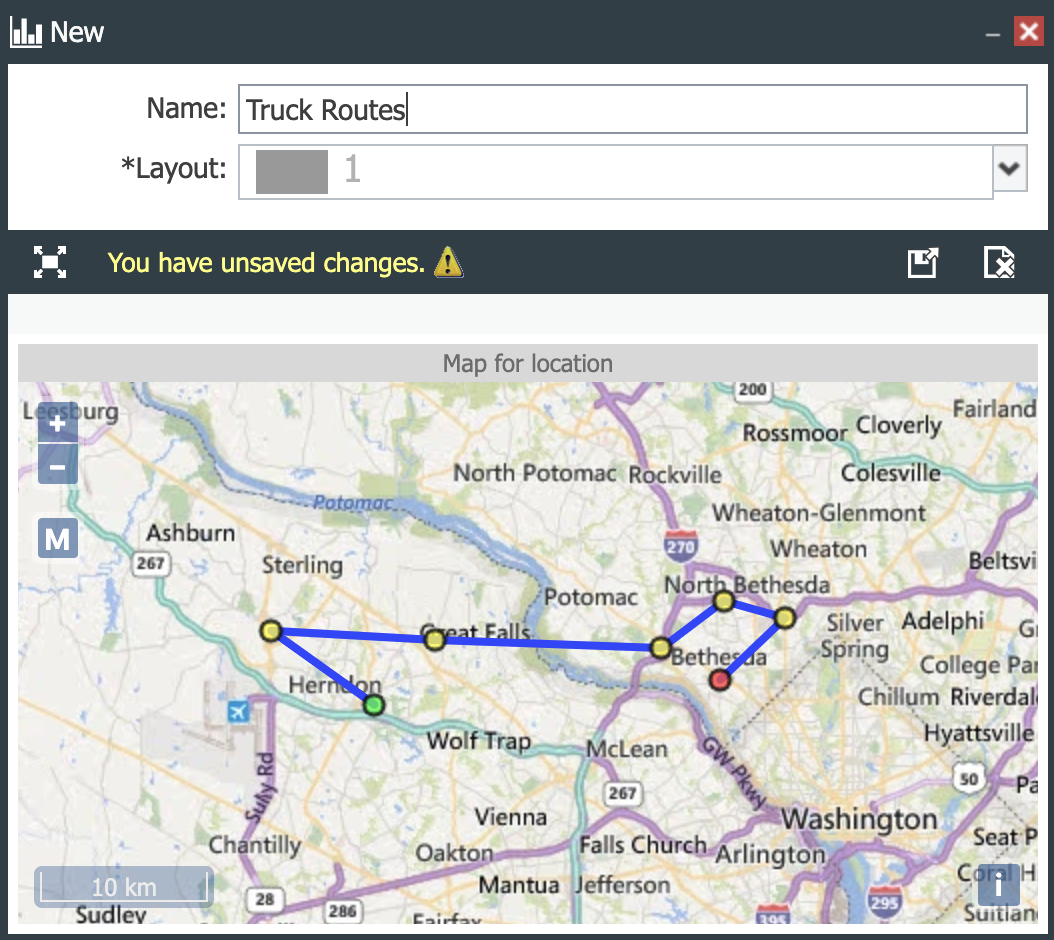
Double click on the unsaved Data View to open it and set its properties.
-
Enter a Name and select a Layout. For this example, the Layout will be 1.
 |
|---|
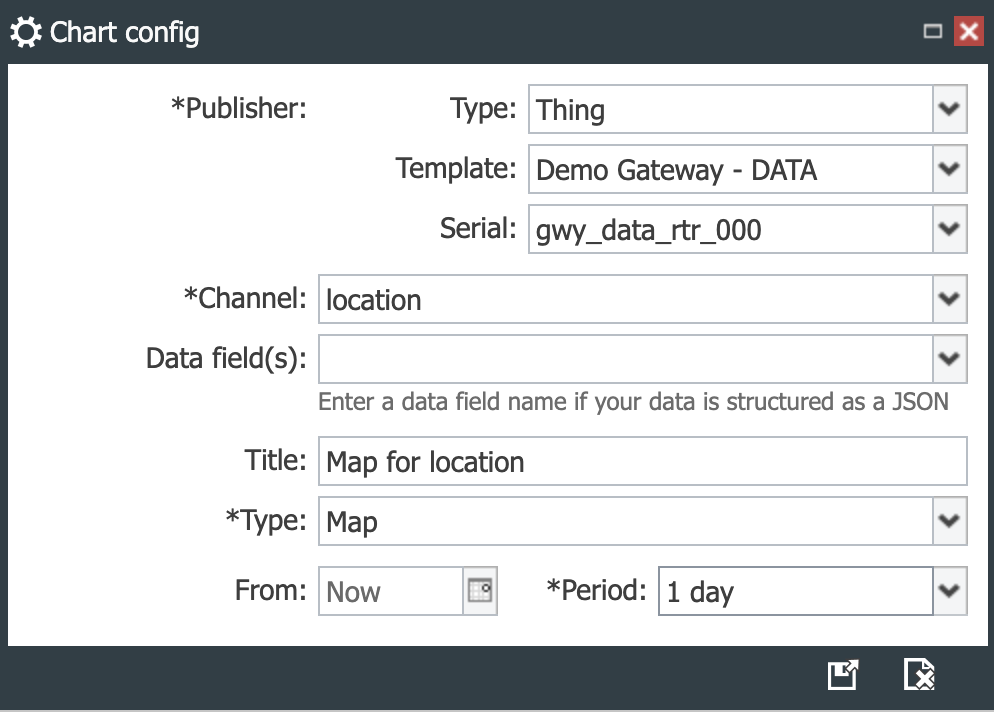
- Click on the configuration gear, give the map a Title and set up the time period that will be charted.
 |
|---|
- Save (
 ) or Save and
Close (
) or Save and
Close ( ) the new Data View. Clicking on a data point displays its properties.
The result is shown below.
) the new Data View. Clicking on a data point displays its properties.
The result is shown below.
 |
|---|