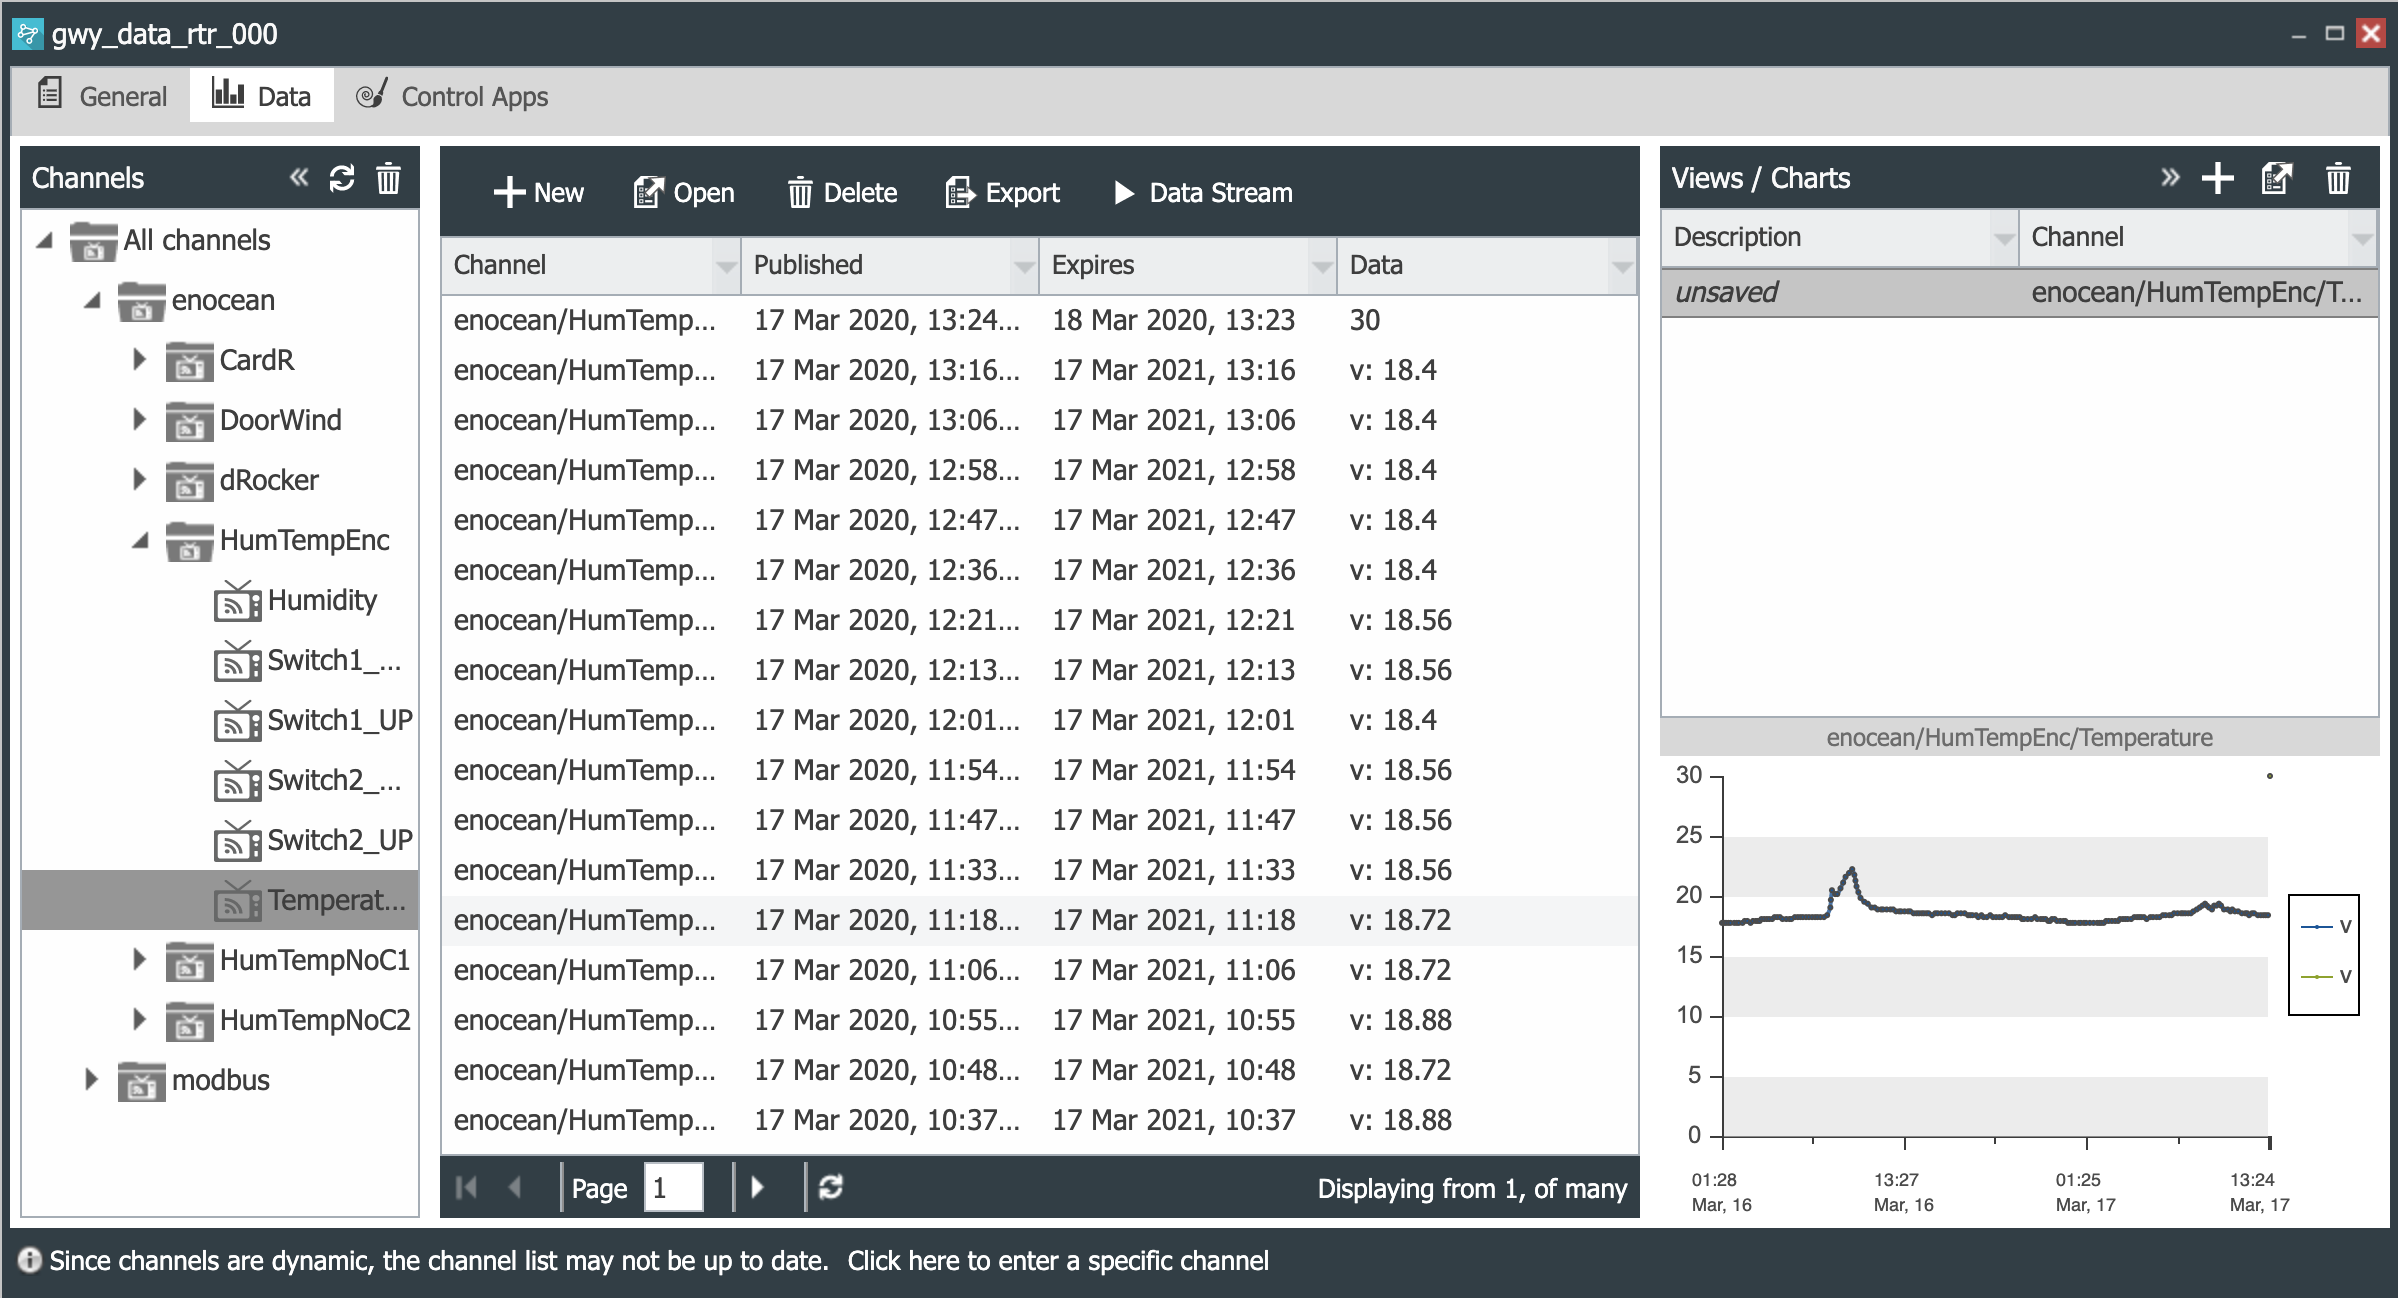
Device Data
![]() The Data tab opens the Data panel which is used to:
The Data tab opens the Data panel which is used to:
- Display and manage the channels/topics used by the device to publish data in the Channels Panel.
- View the data published in those channels.
- Publish data in the name of a Thing or Controller device.
- Edit data already published.
- Export data published.
- Create Data Views such as charts, gauges and maps based on the data published.
Channel Panel
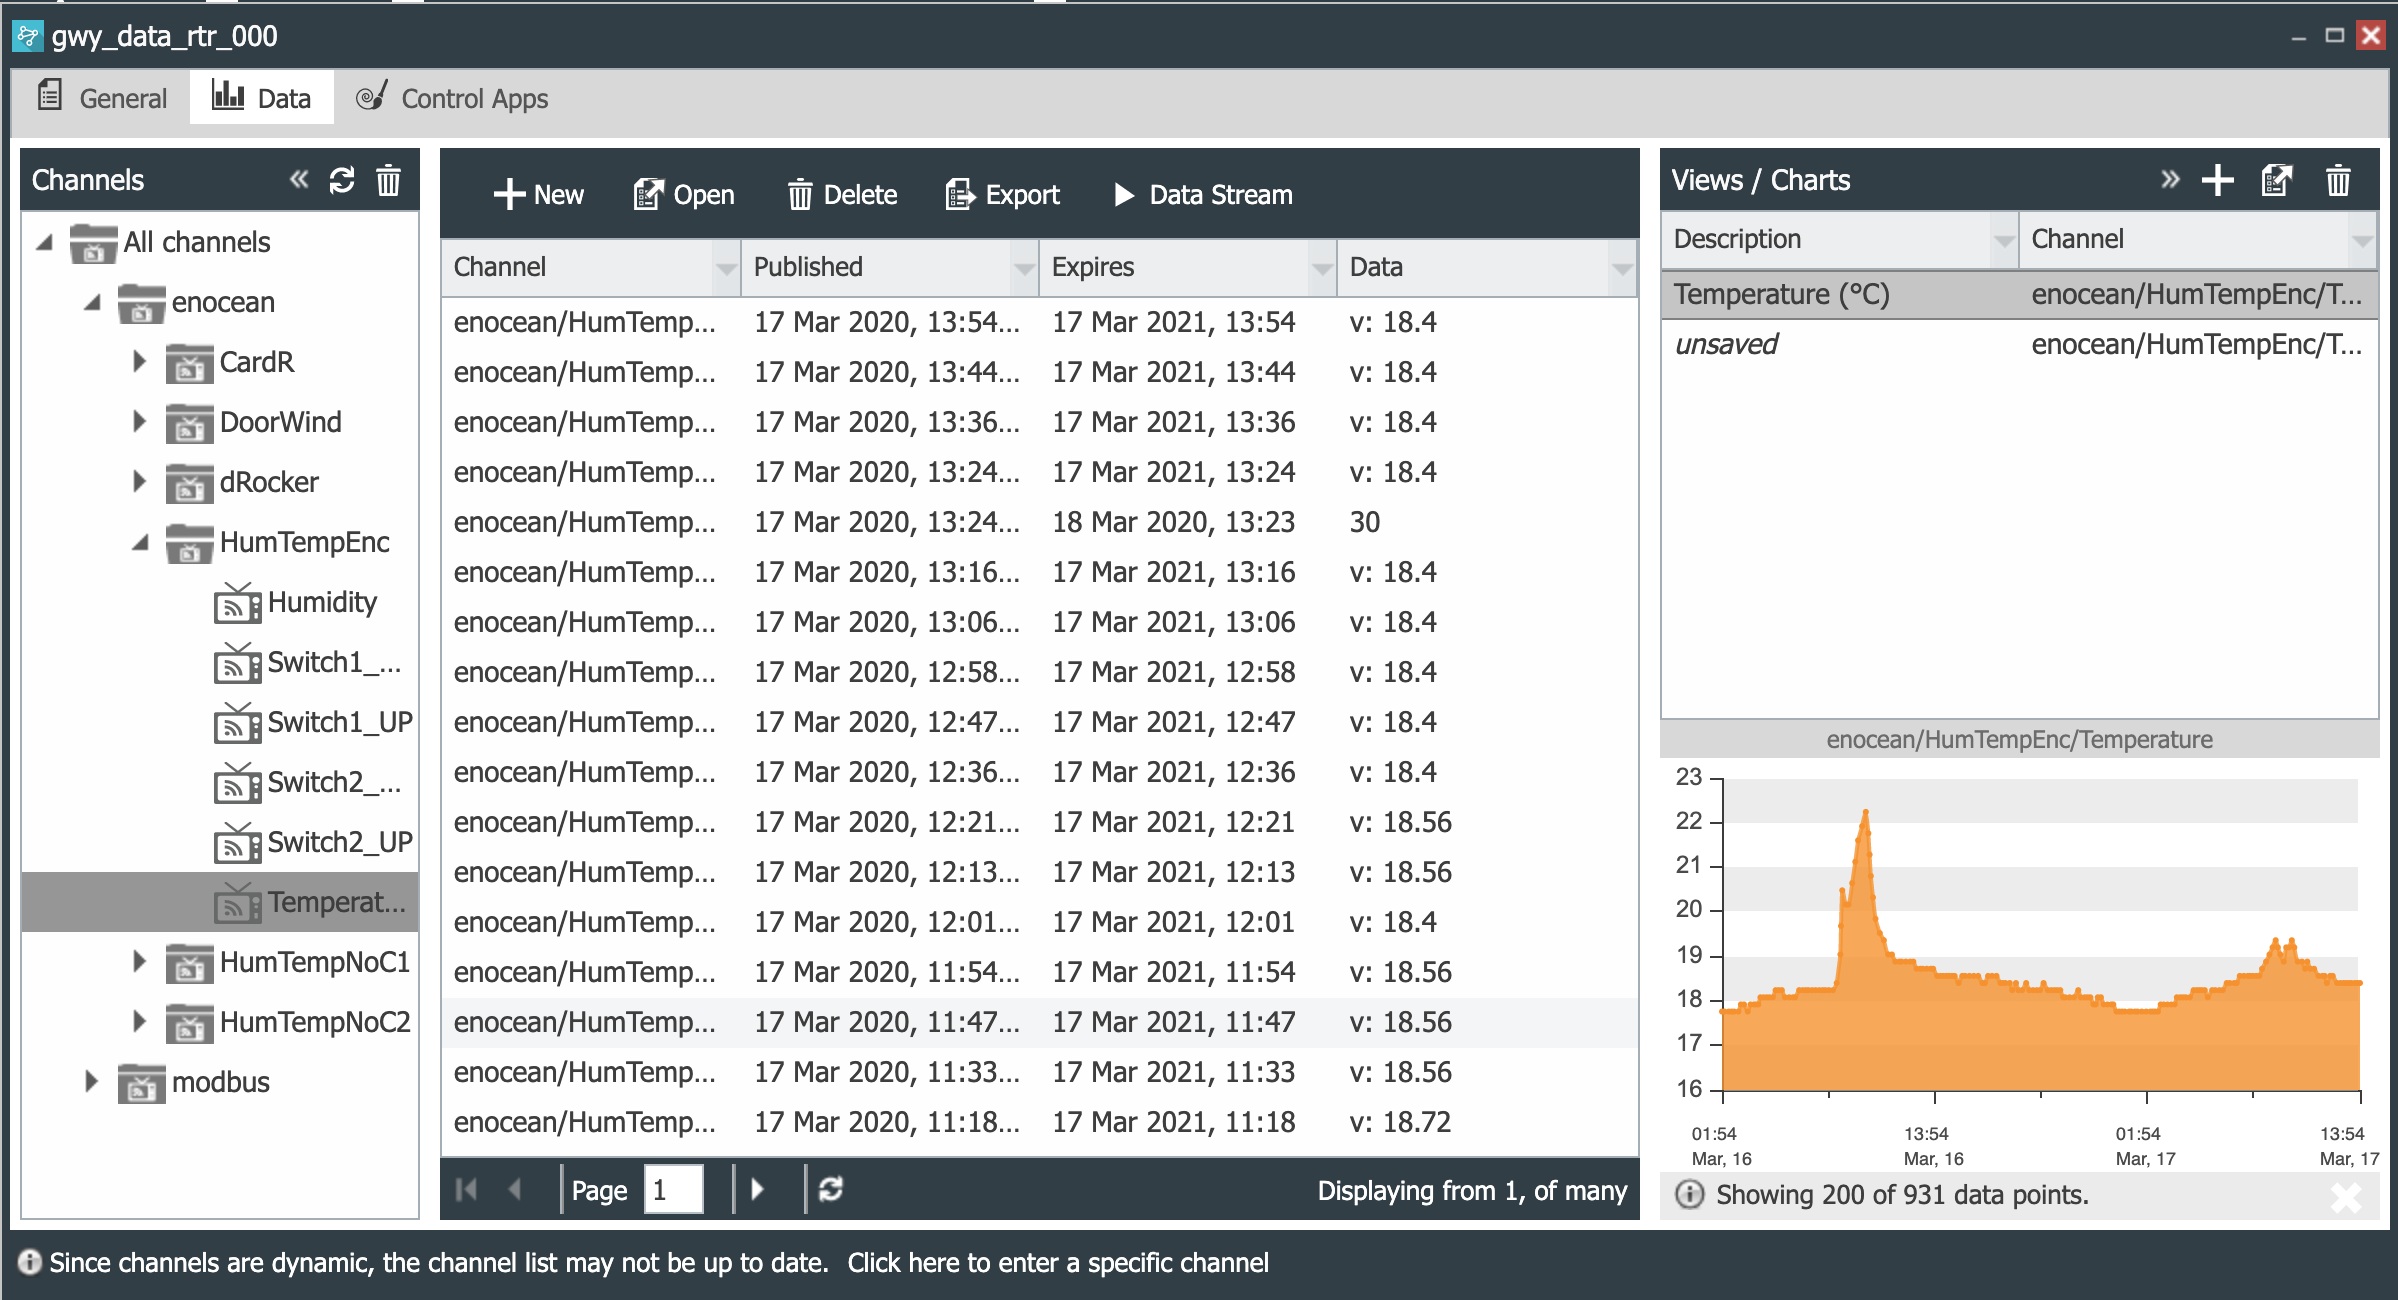
The channel/topic panel displays the list of all the channels used by the device to publish data. Channels are displayed in a hierarchical way for easier navigation.
Channels that have sub-channels are preceded by an arrow head. Clicking on a channel will display its data on the data panel and its sub-channels in the channel panel.
Channels may be Deleted along with all their data and sub-channels by clicking on the ( ) delete icon.
To reload the channel list, click on the Reload ( ) button.
View Published Data
The Data panel displays all the data published by the device on the channel selected.
The panel displays the:
- Channel name containing the data.
- Timestamp, which indicates when the data was published.
- Expiration date, which indicates when the data will be permanently erased from the CloudPlugs platform, and
- Data in JSON format.
The panel’s top ribbon allows the following operations:
- Publish ( ) new data.
- Open and edit (
 ) published data.
 - Delete ( ) the published data.
- Export (
 ) the published data.
 - Data Stream ( ), which allows you to subscribe to a topic to stream and view real-time data with wildcard support for topics.
The bottom ribbon allows navigation of pages of published data. The reload button ( ) reloads the published data panel.
Data Stream
Data Stream allows you to visualize real-time data by subscribing to a channel. To use Data Stream:
- Click on Data Stream to open the Data Stream window.
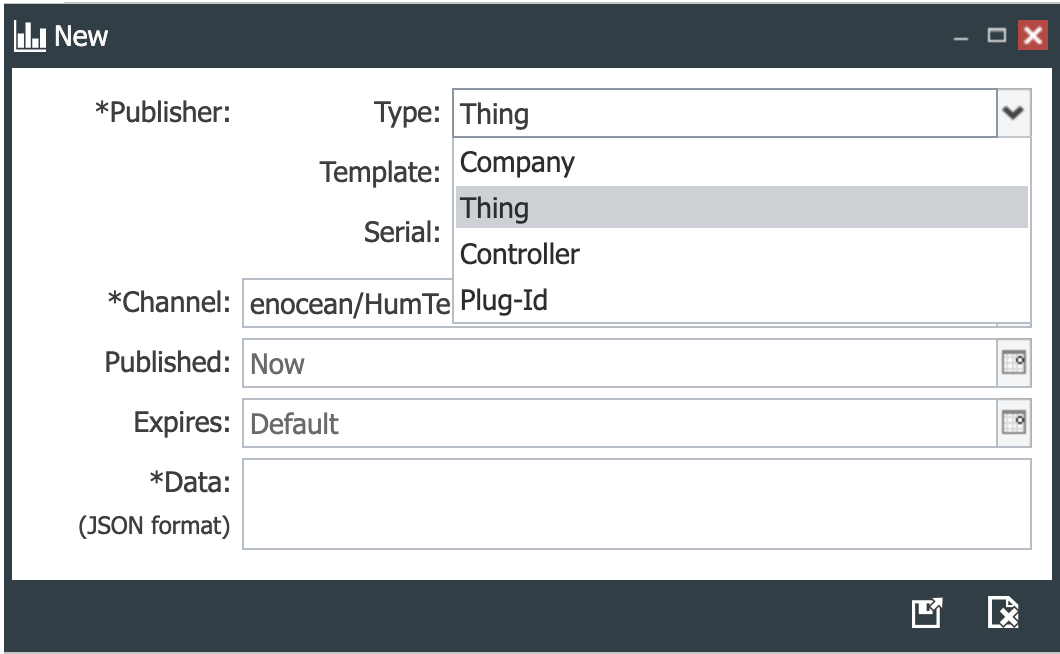
- Select the Type of publisher from the dropdown menu.
- Company - to stream data published as the company account.
- Thing - to stream published data as currently selected Thing.
- Controller - to stream data from a Controller device.
- Plug-ID - to stream data from a device with the Plug-ID entered.
- If Company, Thing or Controller are selected:
- Select or enter the Production Template of the device to publish data.
- Select or enter a valid Device Serial Number or HWID.
- If Plug-ID is selected, enter the Plug-ID of the device whose data you want to stream.
- Enter the channel/topic for the subscription to read and display its data. Wildcards are supported.
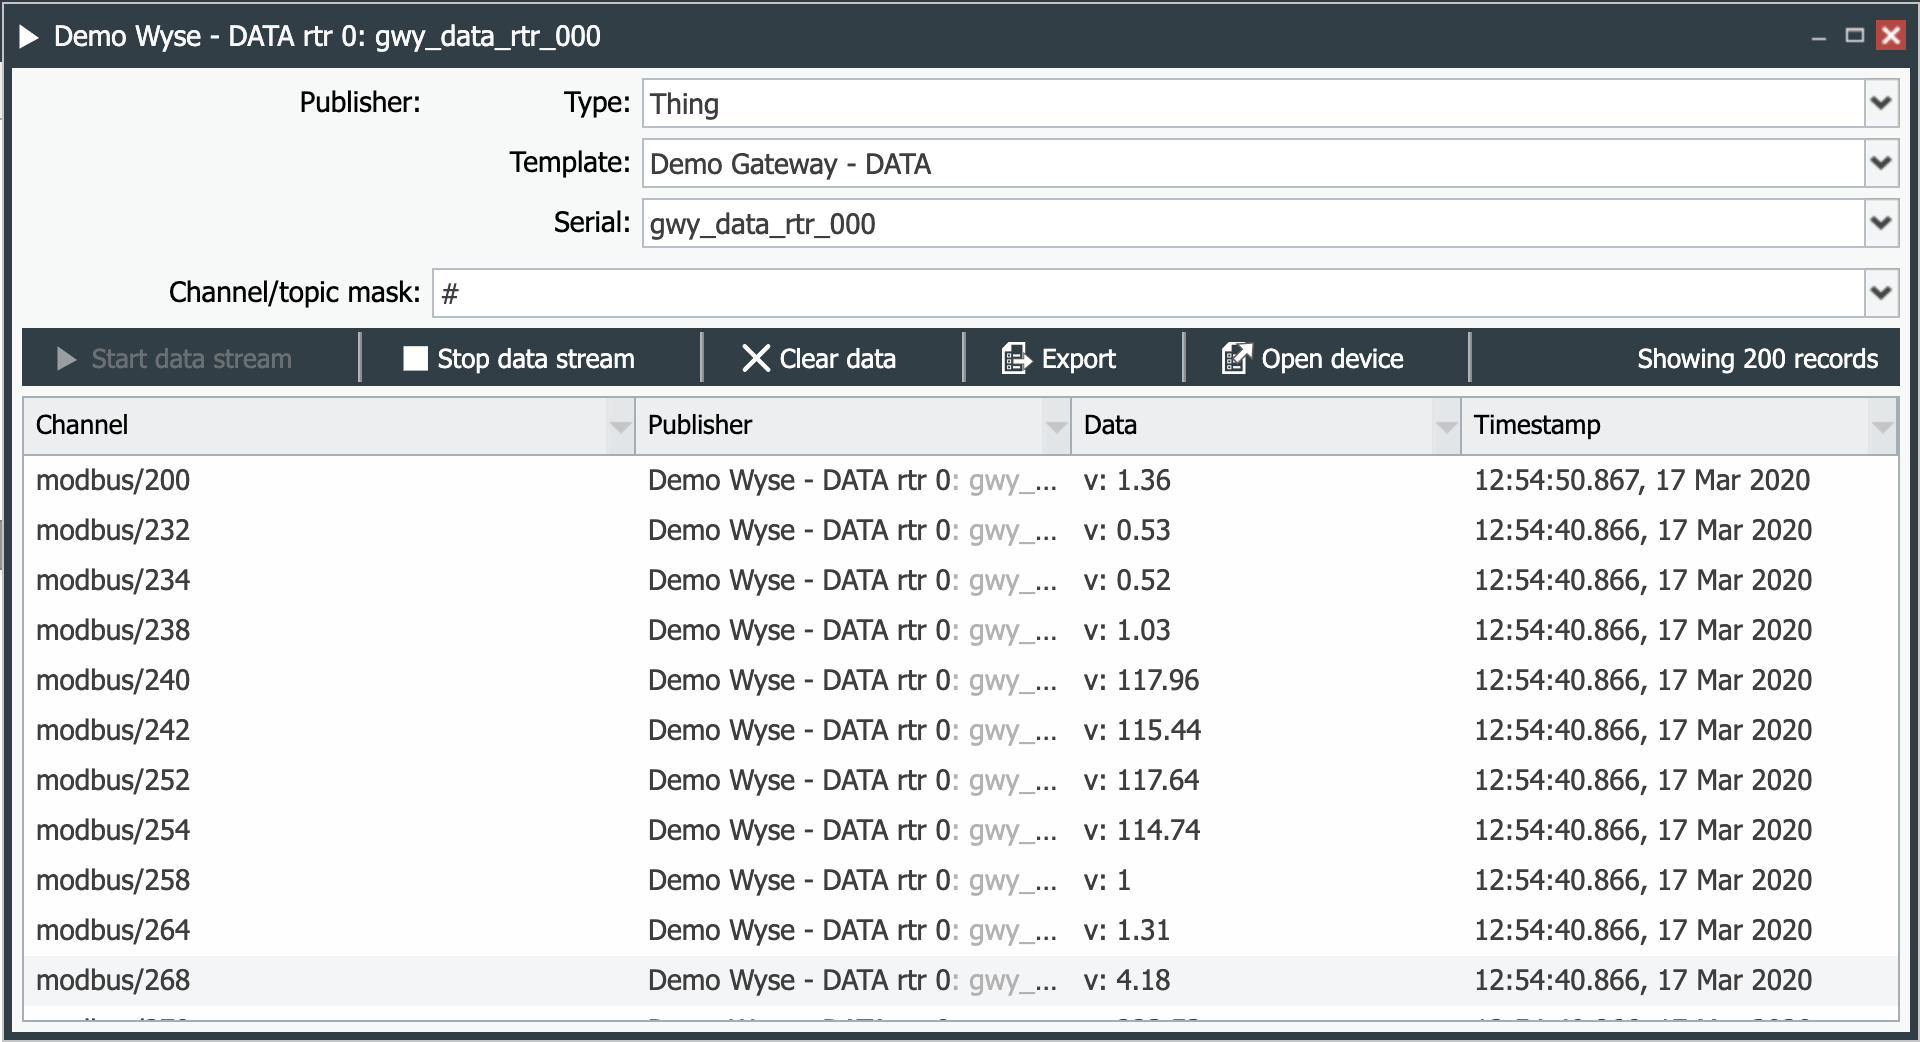
- Click on Start data stream to visualize data. The last published data is shown at the top of the list. The following information is displayed for the last 200 data points published:
- Channel - the channel or topic whose data is streamed.
- **Publisher - ** the publisher of the data.
- Data - the data published in JSON format.
- Timestamp - the timestamp of the data being published.
The additional following options are available:
- Stop data stream stops the subscription and flow of data.
- Clear data clears all data in the panel.
- Export exports the last 200 records in the data stream.
- Open device opens the Data panel of the device selected from the list. The list allows scrolling of the last 200 records published.
Here is a sample data stream using a “#” wildcard.
Publishing Data
This functionality allows to publish data impersonating a Thing or Controller device. It is used to test specific device or application behavior when certain data is received by the platform.
Data may be:
- Numeric positive or negative.
- Alphanumeric.
- Structured JSON.
- Location coordinates in a JSON structure.
To publish data:
- Open the Publish Data window with the New Data (
 ) button in the Data Panel.
 - Select the Publisher which can be one of:
- Company - a universal publisher that is not associated with any device and whose data published is visible to all devices.
- Thing - a Production Thing device.
- Controller - a Controller device.
- Plug-ID - the Plug-ID of the device that will publish data.
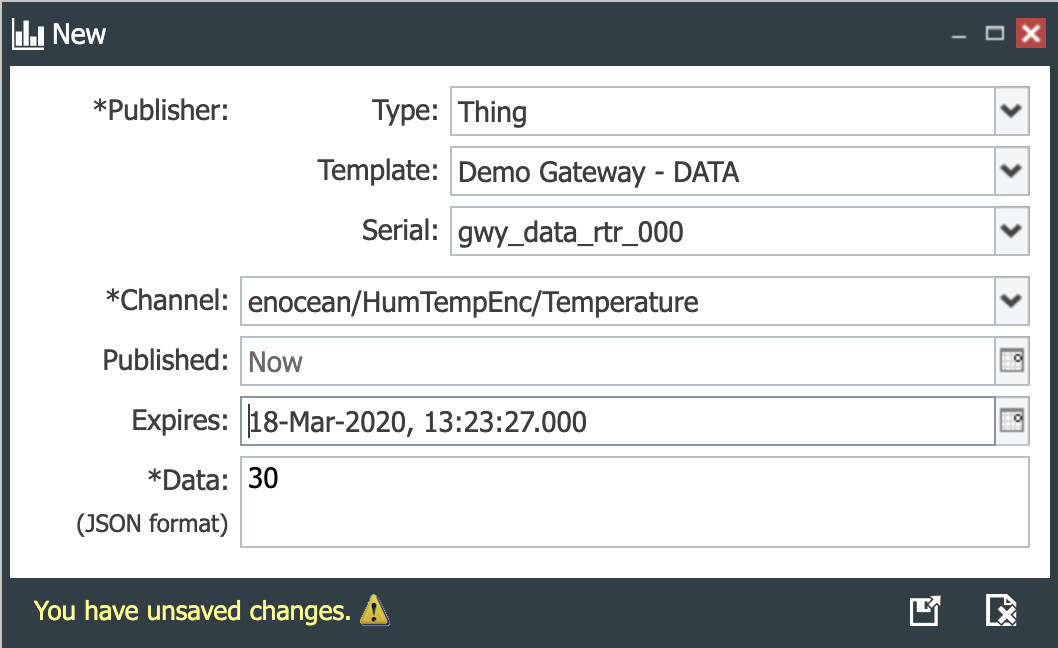
- If Company, Thing or Controller are selected:
- Select or enter the Production Template of the device to publish data.
- Select or enter a valid Device Serial Number or HWID.
- If Plug-ID is selected, enter the Plug-ID of the device whose data you want to stream…
- Enter the target channel name. If an existing channel name matches the channel as it is entered, it will be suggested to you.
- Select the date and time of publishing using the available calendar. Back dates are allowed.
- Select the expiration date and time of the data. Only future times are allowed. Data can live as little as one (1) minute and it can live up to 6 months.
- Enter the data which can be:
- Positive or negative number or numbers. If more than one number is entered then:
- Only the last number is accepted if they are separated by commas (e.g., enter 1,2 and only 2 is accepted). Same happens if you enter 1, in one line and 2 in the line below.
- Numbers entered in separate lines without a comma separator are accepted (e.g., entering 1 in one line and 2 in another results in data “1 2”.
- Decimal numbers are accepted. For example, 1.2 is accepted as 1.2. 1.2, 1.3 results in 1.3 being published.
- Positive or negative number or numbers. If more than one number is entered then:
- Alphanumeric data. You can publish data such as "abc", "1 23 ab c", "1;3;x;y;z" etc.
- Structured JSON objects. JSON objects have the syntax:
{ "internal": 70, "external": 90 } - Location coordinates, which have the syntax:
{
	"x": 70.1234578676,
	"y": -65.098080890
	}
where x is the longitude and y is the latitude relative to Greenwich.
- Save and Close (
 ) to see the data displayed on the Data panel and on the chart.
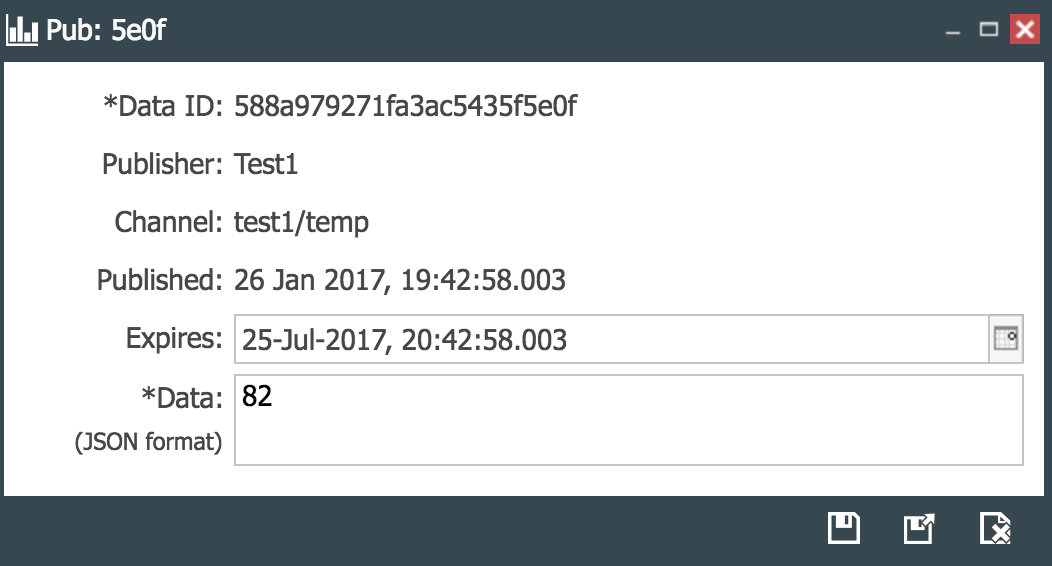
The following images display the publish action of device Test1 of temperature value 80 on channel test1/temp, and the result of multiple publish actions on the same channel.
 |
 |
|---|
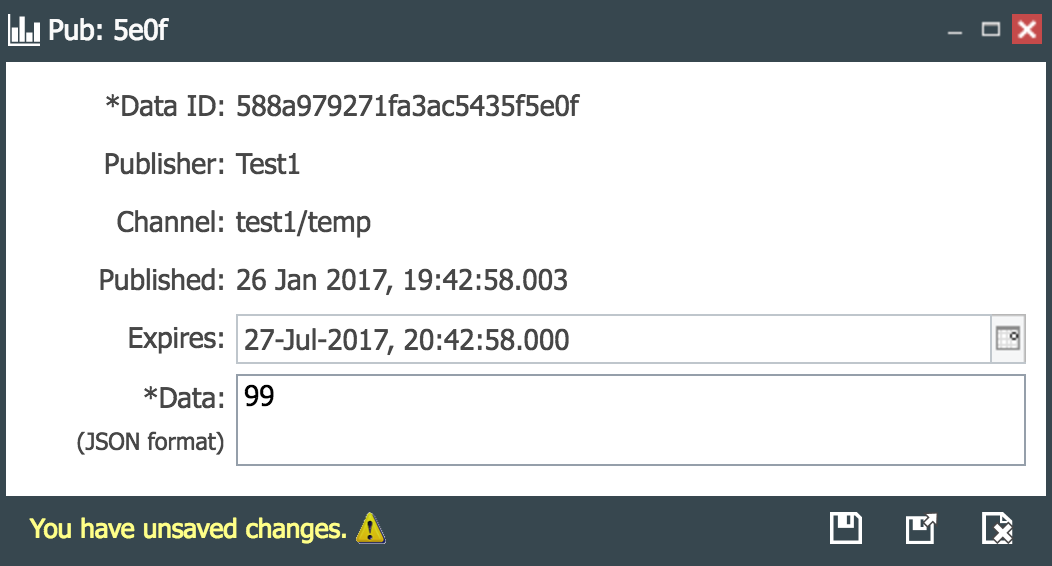
Edit Published Data
Data that has been published can be edited as follows:
- Select and Open the published data of interest by double clicking on it or using the Open () button.
- Modify the expiration date to a past or future time period.
- Modify the data itself with any valid JSON.
- Save (
 ) or Save and Close ().
The images below show a published data before and after its expiration data and value have been modfied.
 |
 |
|---|
Export Published Data
The data published in a channel can be exported into .CSV files. JSON structures will be exported as such.
IMPORTANT!
The export action will export all the data existing in the selected channel.
To export the data of a particular channel:
- Select the channel or sub-channel from the Channels Panel.
- Click on the Export () button.
- Open the .CSV file downloaded to confirm that the data has been properly received.
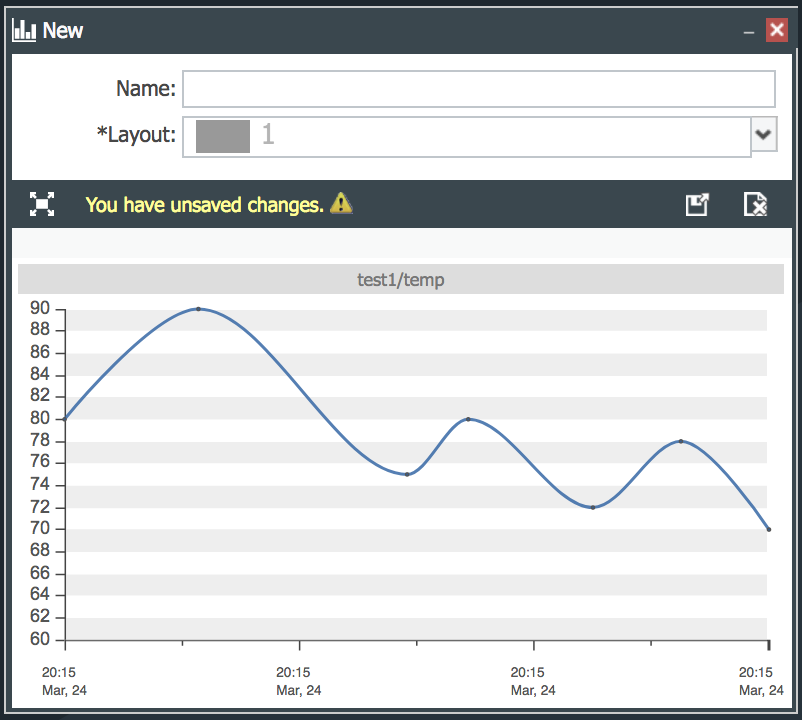
Create Data Views
The Views/Charts panel allows the creation and saving of custom data views that are updated in real time as data is published in the platform. By default, the platform creates and updates line charts when numeric data is published.
To create or save a data view:
- Double click on the row containing the channel for which you want to create a data view.
- Enter a Name for the Data View.
- Select a layout. Multipanel layouts allow you to create multiple views of the data from one or multiple channels.
- Click on the panel you want to configure and enter the required data:
- Publisher - a Thing, Controller, a device identified by a Plug-ID, any device or Company. The data published by Company is visible to all devices.
- Channel - from which the data will be read.
- Data Field - if the data is a JSON with data fields
- Title - gives a title to your chart
- Select the type of chart which can be a Line, Bar, Gauge or Map chart.
- Enter the starting date for the chart and the period that you want to display. These parameters do not apply to Gauges.
Line charts allow color and fill selection.
Bar charts allow color selection and Map charts only start date and period. Gauges have their own set up.
In addition, the following actions can be made on Data Views:
- The Data View panels can be edited by clicking on the panel’s gear icon.
- Time based charts allow:
- Scrolling over time periods with the forward (>) and backwards (<) arrows.
- Zoom into a period. Simply position your pointer on the desired date and drag a rectangle over the period you want to zoom into. To unzoom click on the (
 ) button.
Here are two examples for creating numeric and location based data views.
Numeric Data Views example
Here is an example that shows how to create a data view from numeric data for a device. The process is similar for Controller devices.
- Open the device and then open the Data tab (
 ).
).
- Open the unsaved Data View to edit it. You can open it by double clicking on it, or selecting and clicking on the Open button ( )
- Enter a Name for the view and select a Layout type. For this example, we choose to have two panels.
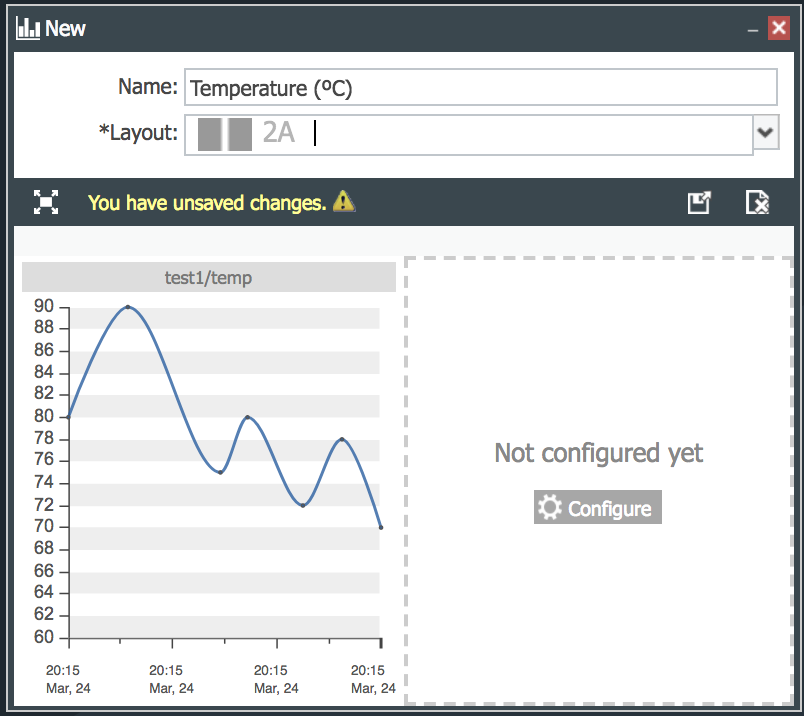
-
Click on the line chart to bring up the configuration gear icon, and press on the icon.
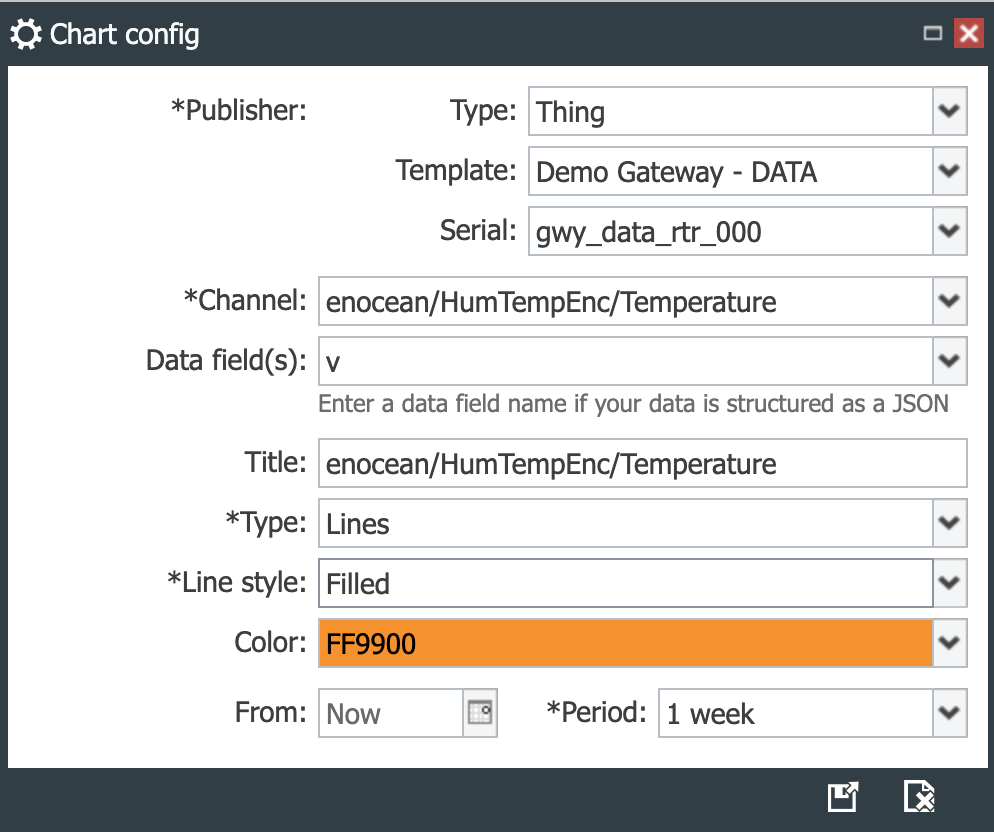
-
Configure the line chart as desired. Here we selected to have a filled chart with orange color.
-
Save and Close (
) the configuration window. -
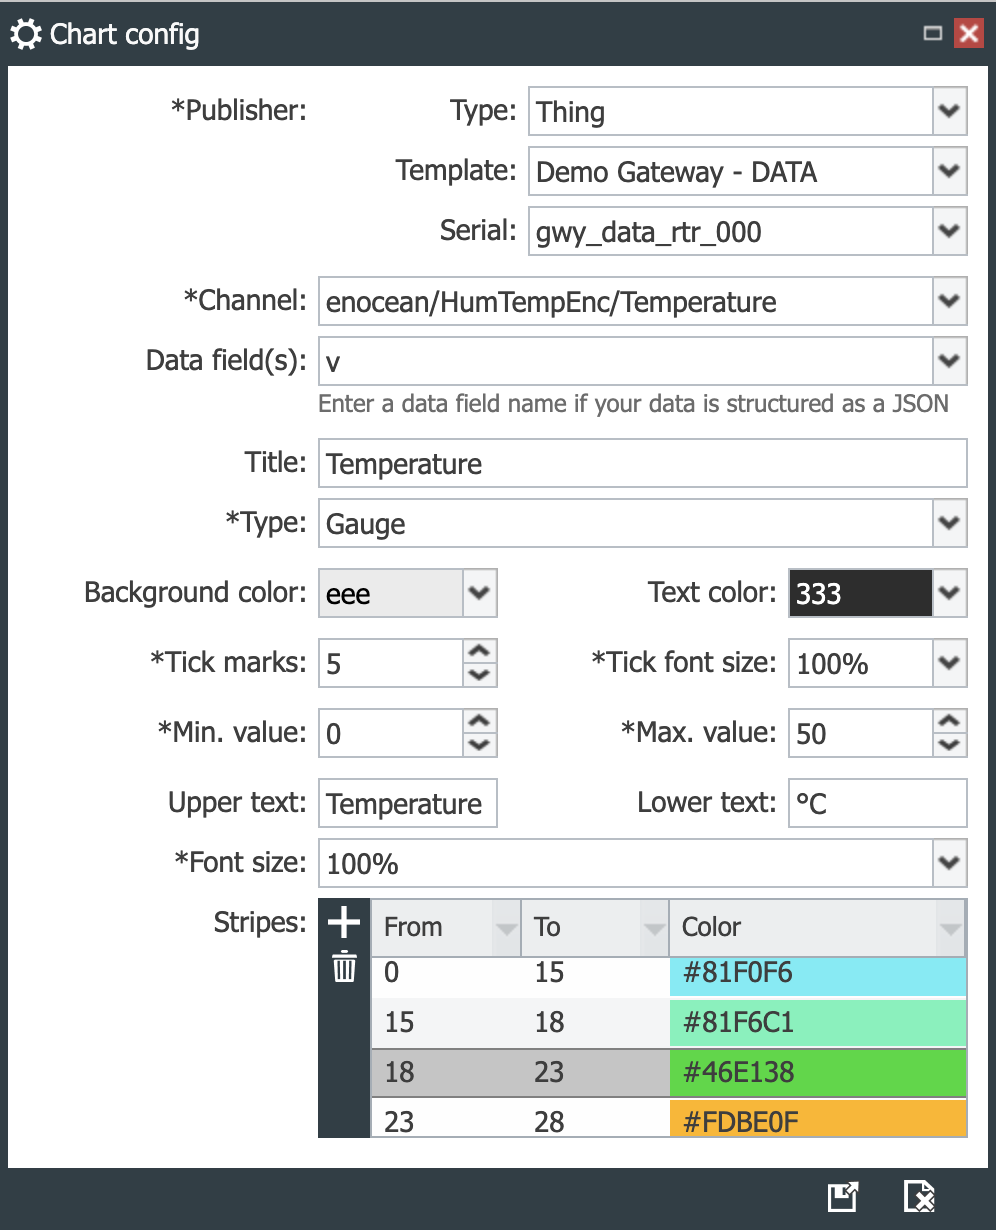
Click on the Configure gear on the second panel.
- Let’s configure a gauge as follows and save the configuration.
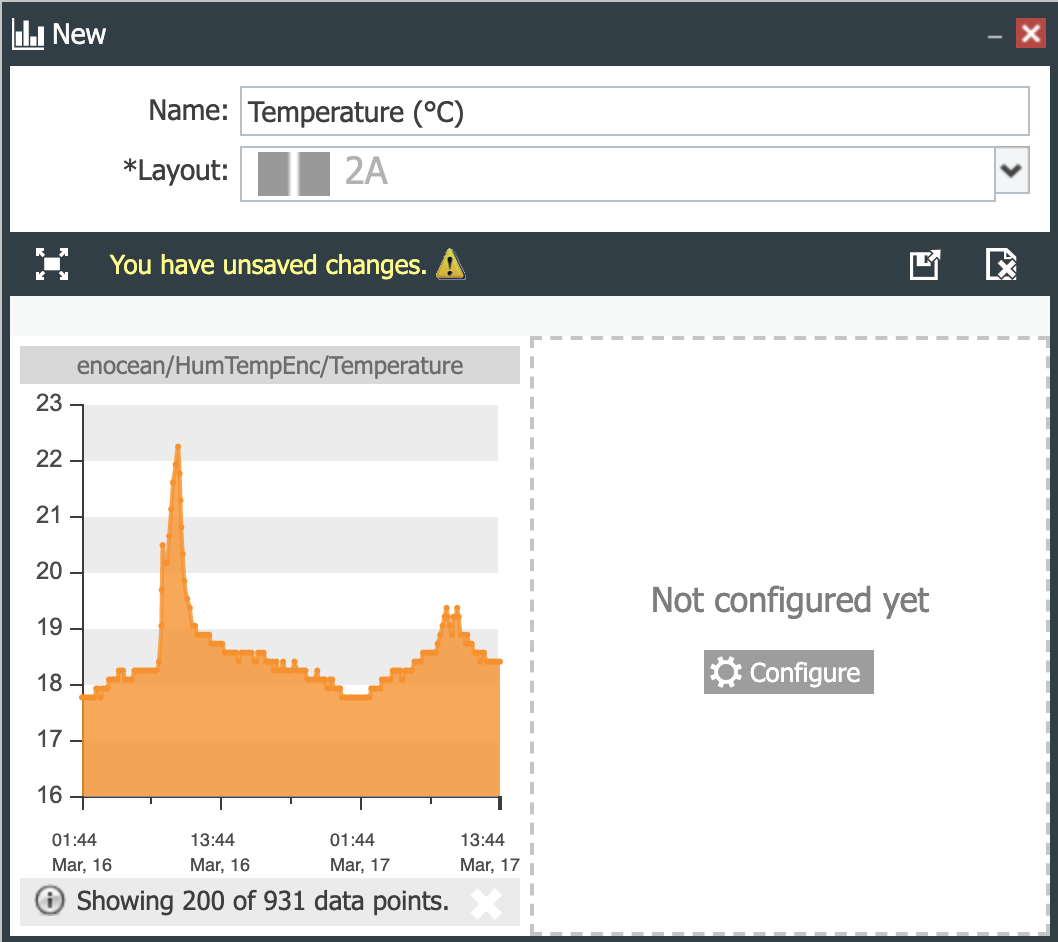
- The result is as follows.
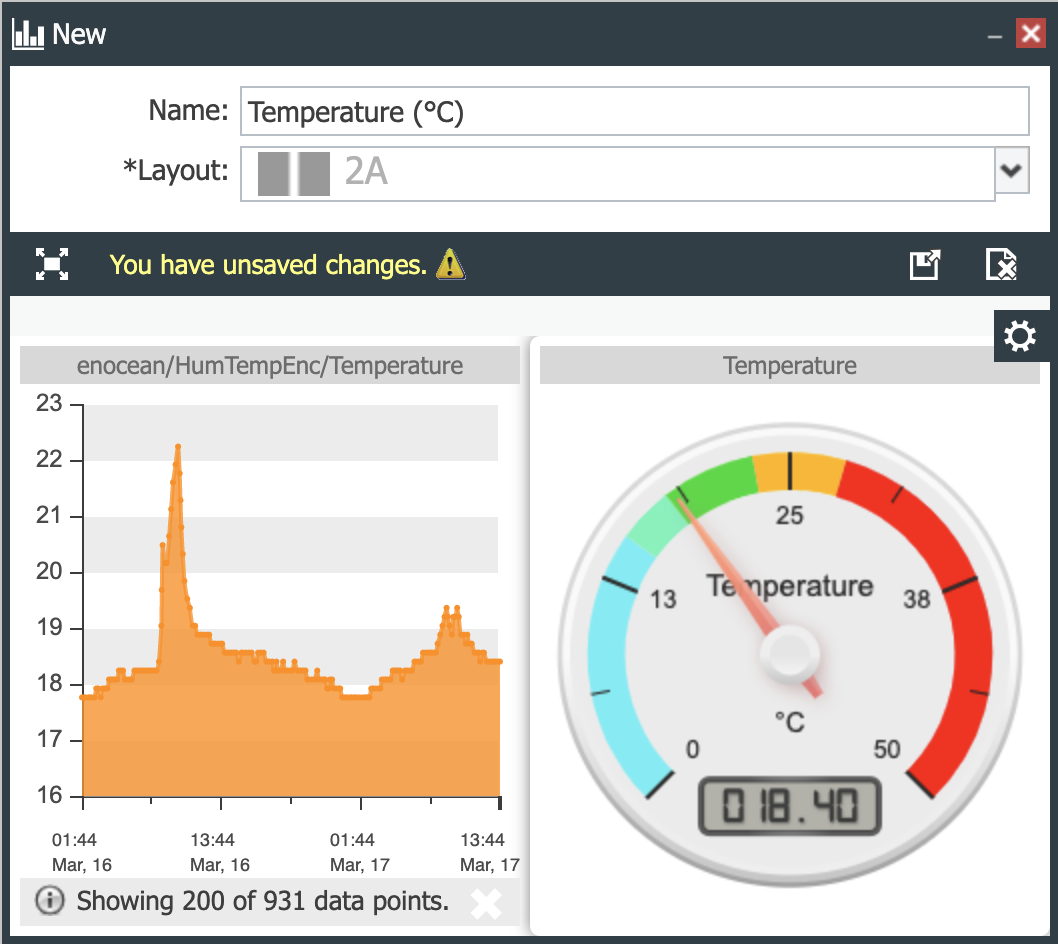
Note that due to space limitations, the device view will only show the line chart, as shown below. However, the View created can be accessed
from the Published Data ( ![]() ) -> Data Views application.
) -> Data Views application.
Location Data Views Example
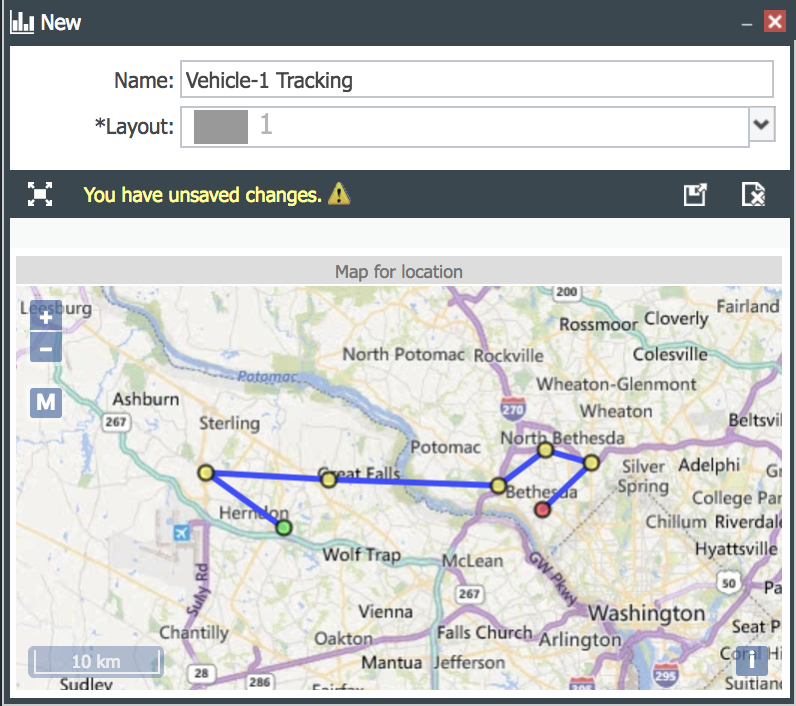
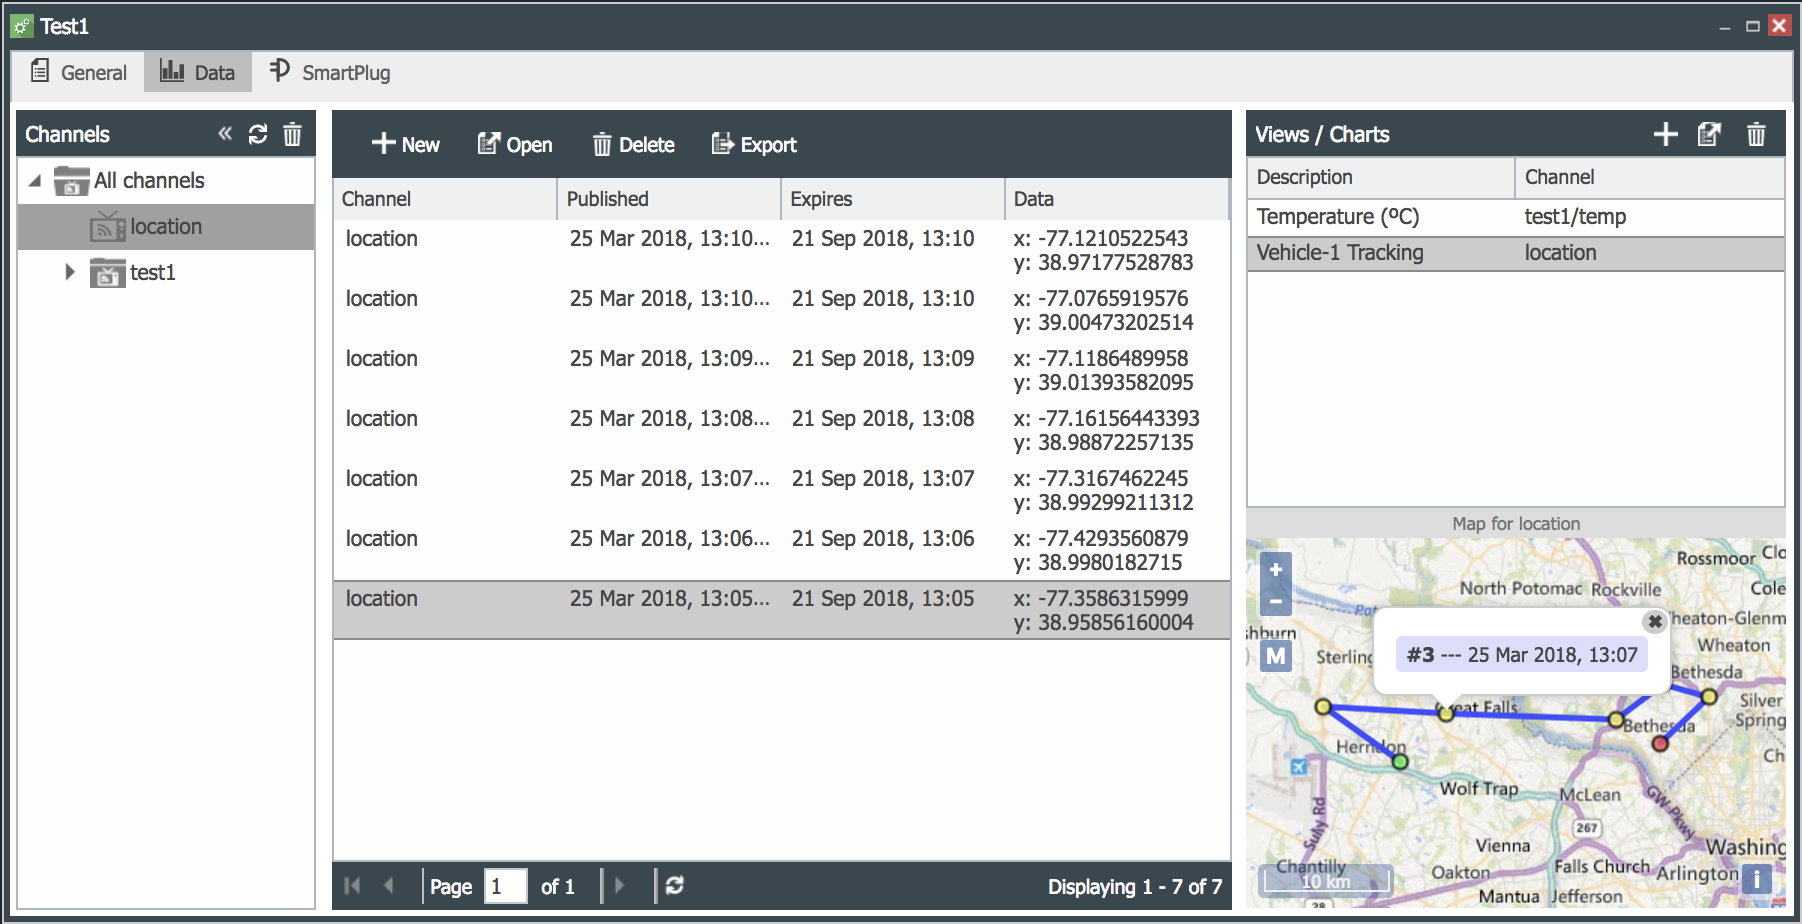
This example shows how to create a data view based on location data of a mobile device.
- Publish location data in a channel that we call location as shown below. As the data gets published the trace of movements is shown on the Views / Charts panel.
Note that clicking on a point indicates the number of the data point and the timestamp. See the image below. We clicked on the 3rd data value and its number and timestamp are displayed on the chart.
-
Double click on the unsaved Data View to open it and set its properties.
-
Enter a Name and select a Layout. For this example, the Layout will be 1.
-
Click on the configuration gear, give the map a Title and set up the time period that will be charted.
-
Save (
) or Save and
Close () the new Data View. The result is shown below.