Statistics
![]() The Statistics tab opens the Statistics panel which provides
information on:
The Statistics tab opens the Statistics panel which provides
information on:
- Usage Services usage.
- Storage consumed by the device in the last 3 months.
- Traffic used by the device in the last 3 months.
- Messages Published by the device in the last 3 months.
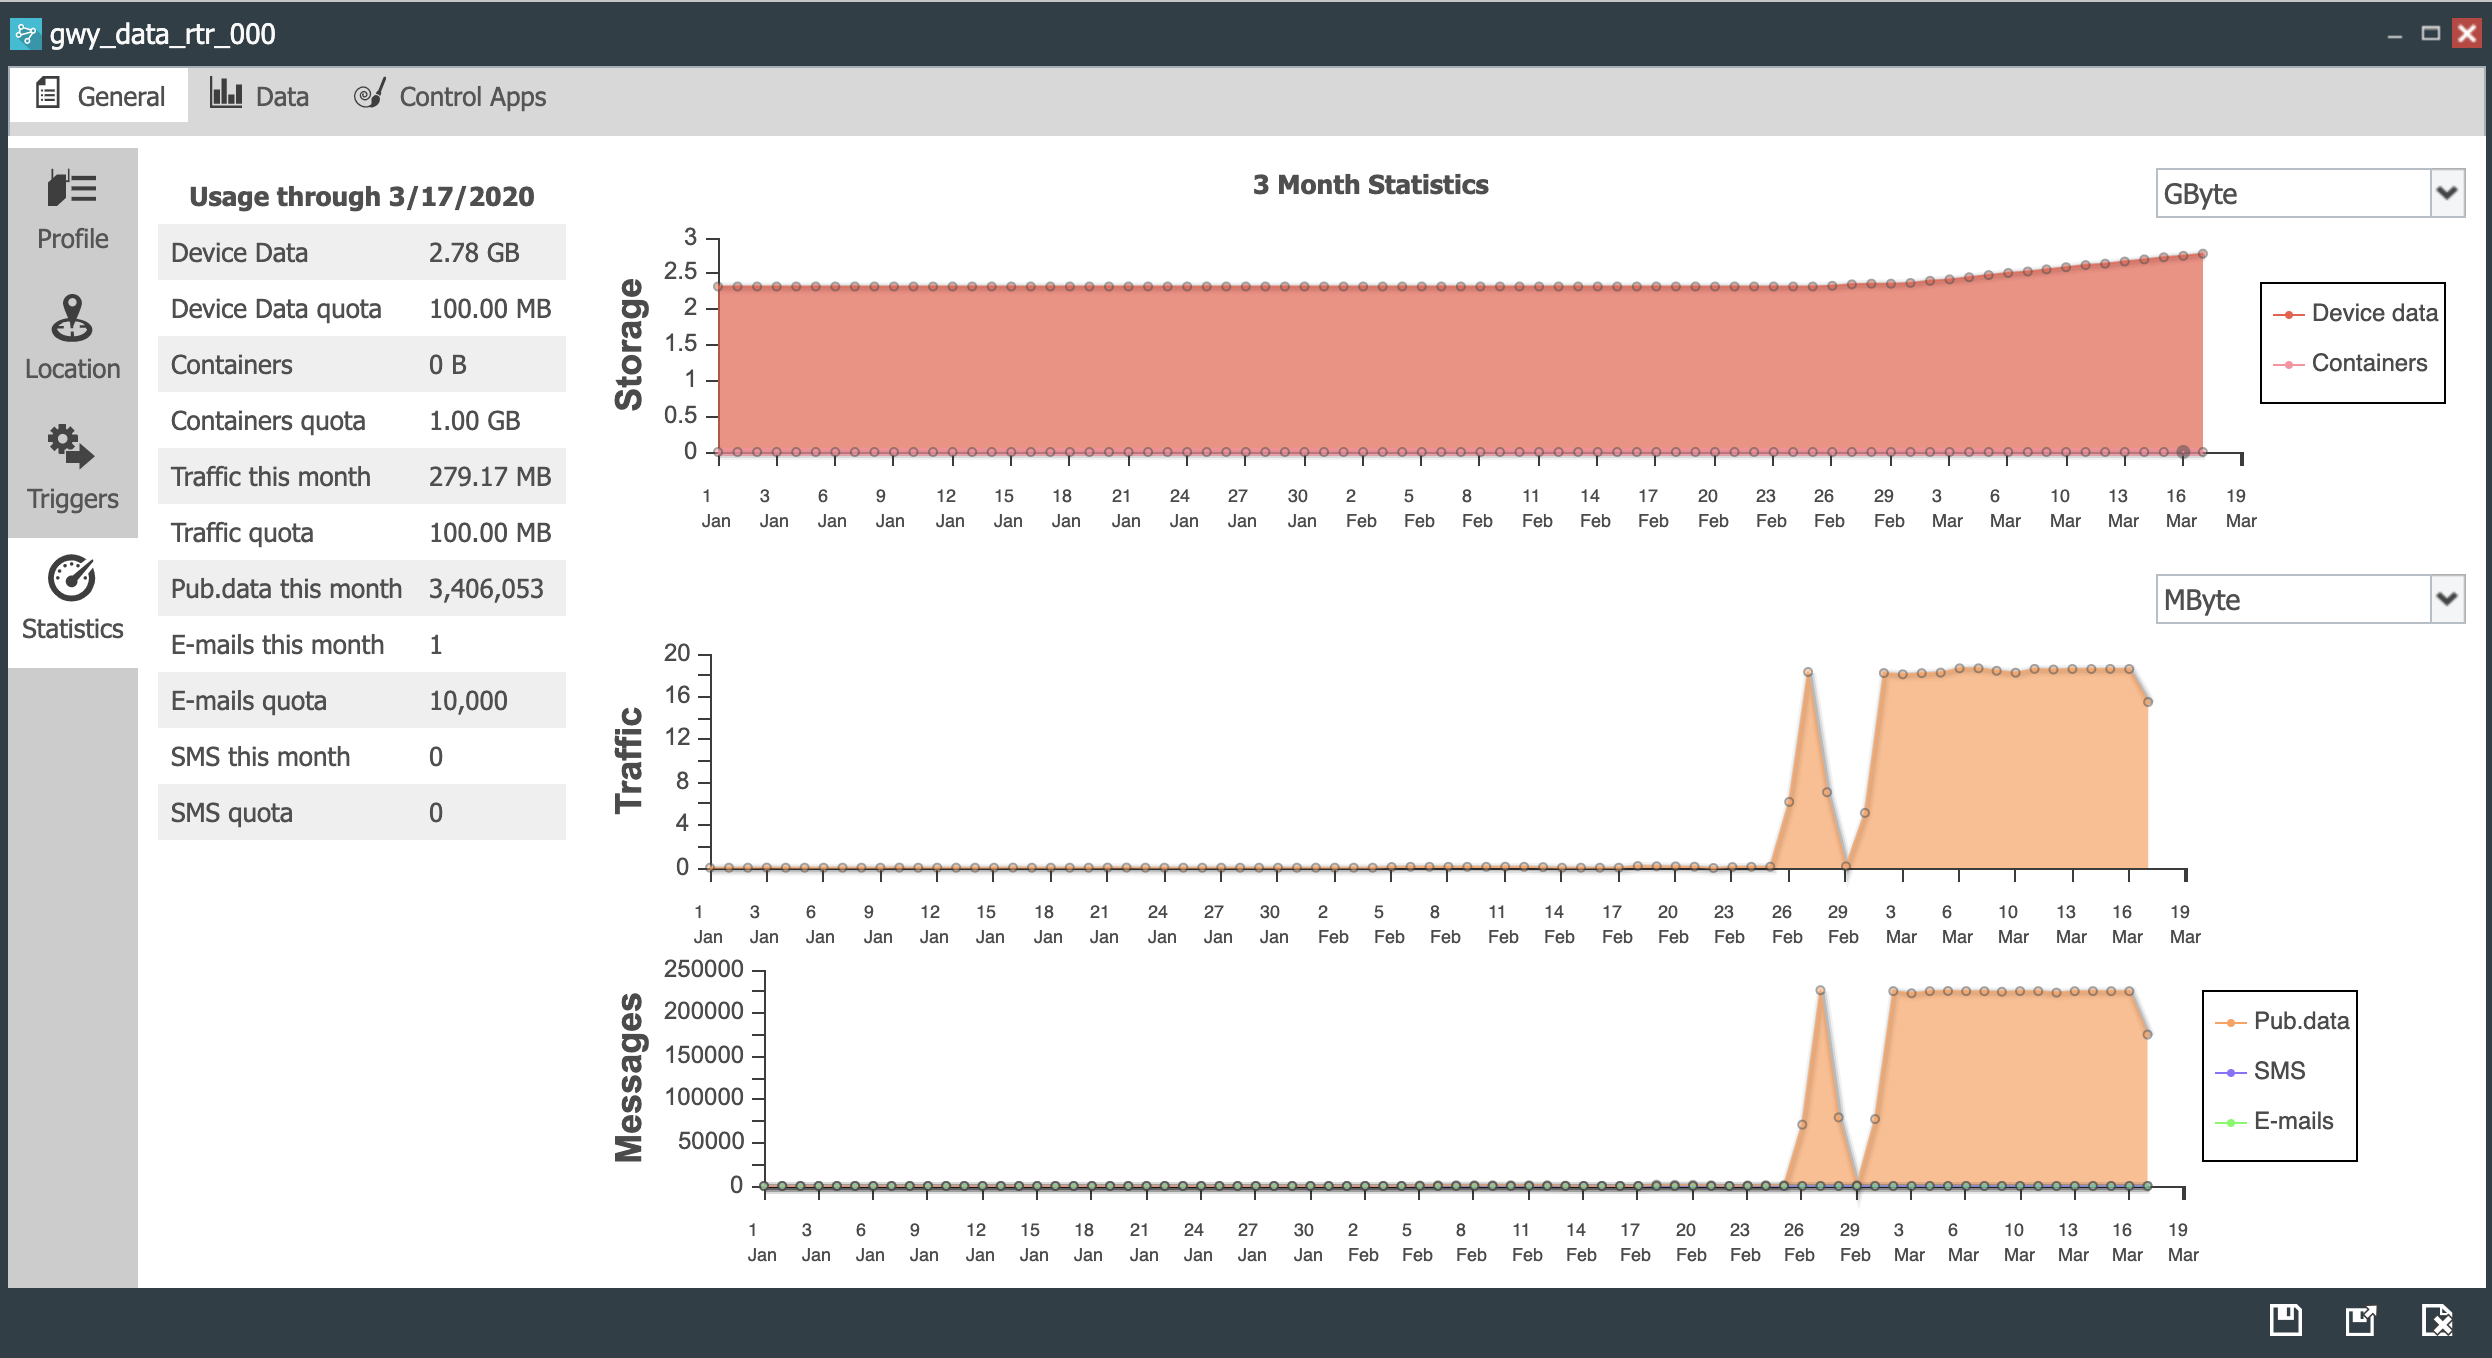
Services Usage
The left table of the Statistics panel presents a summary of the service and resource consumption of the device:
- Device Data. Displays the amount of CloudPlugs IoT storage that the device was using as of midnight the previous night.
- Device Data quota. Indicates the monthly storage allowance for the company account.
- Containers. Indicates the amount of storage buckets and containers used by the device.
- Containers quota. Indicates the monthly storage for containers in the company account.
- Traffic this month. Indicates the amount of traffic used by the device this month.
- Traffic quota. Indicates the monthly traffic allowance for the company account.
- Pub.data this month. Indicates the amount of data published by the device to date in the current month.
- E-mails this month. Indicates the number of emails sent by triggers programmed in the device.
- Emails quota. The number of emails allowance for the company account.
- SMS this month. Indicates the number of SMS messages sent by triggers programmed in the device.
- SMS quota. Indicates the SMS allowance for the company account.
Storage
The Storage chart displays the traffic consumption across the last 3 months. The chart data can be shown in kBytes, MBytes or GBytes.
Traffic
The Traffic chart displays the traffic consumption across the last 3 months. The chart data can be shown in kBytes, MBytes or GBytes.
Messages Published
The Messages chart displays the messages published by the device during the last 3 months. The chart data can be shown in kBytes, MBytes or GBytes.