Data Visualizer
 |
The Edge One™ Data Visualizer uses Grafana to visualize data stored in a local datastore. |
|---|
Edge One™ also supports the use of Grafana to explore, visualize and analyze time-series data. Grafana allows you to query, visualize, alert on and understand your metrics no matter where they are stored. With Grafana you can create, explore, and share dashboards with your team and foster a data driven culture.
Grafana supports over 30 open source and commercial data sources allowing you to pull together Edge One™ project data and external data wherever it lives to build dashboards that meet the stringiest requirements.
The key features of Grafana include:
| Visualization | Fast and flexible client side graphs with a multitude of options. Panel plugins for many different way to visualize metrics and logs. |
| Dynamic Dashboards | Create dynamic & reusable dashboards with template variables that appear as dropdowns at the top of the dashboard. |
| Explore Metrics | Explore your data through ad-hoc queries and dynamic drilldown. Split view and compare different time ranges, queries and data sources side by side. |
| Explore Logs | Support for switching from metrics to logs with preserved label filters. Quickly search through all your logs or streaming them live. Works best with the Grafana Loki data source but support for more is planned. |
| Alerting | Visually define alert rules for your most important metrics. Grafana will continuously evaluate and send notifications to systems like Slack, PagerDuty, VictorOps, OpsGenie. |
| Mixed Data Sources | Mix different data sources in the same graph! You can specify a data source on a per-query basis. This works for even custom datasources. |
| Annotations | Annotate graphs with rich events from different data sources. Hover over events shows you the full event metadata and tags. |
| Ad-hoc Filters | Ad-hoc filters allow you to create new key/value filters on the fly, which are automatically applied to all queries that use that data source. |
For details on how to use and configure Grafana, please consult its documentation.
To use the Grafana connector on Edge One™:
-
Configure and run an internal datastore server such as InfluxDB or an external database configured through the Datastore Connector.
-
Deploy the Grafana Data Visualizer container for the processor architecture of the system hardware running your Edge One™. The Grafana containers for various architectures are available in the Containers Registry in the web desktop of your CloudPlugs IoT account. The container must show in the Modules list under Gateway before you can use it.
To learn to deploy containers on Edge One™, refer to the Container Configuration Guide.
- Open the Services menu item under Settings in your Edge One™.use the Datastore Server panel under Services.
- Select Grafana from the Data Visualizer panel’s dropdown menu.
- Click on Save & Reboot. This will save your setup and reboot the system used by Edge One™ for the configuration to be completed.
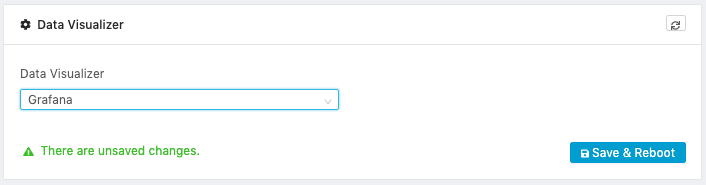
Figure 1. Grafana Configuration.
Grafana is now ready to be configured.
To access and configure Grafana:
- Open the Data Visualizer panel under Gateway which will open a new browser tab with the Grafana user interface.
- Configure the data source which will be either InfluxDB or a datastore configured with the Datastore Connector.
- Create your dashboard.