4. Services
The Edge One™ Platform includes a number of services:
- A Web Server that can be configured to fit your network access and security requirements.
- An internal MQTT Broker which can be replaced by a Mosquitto broker, a custom broker or an ActiveMQ broker.
- The ability to configure a Datastore server for storing real-time time series data.
- The ability to configure a Data Visualizer for the time series data stored in the Datastore.
This guide presents the methods for configuration of all these services.
Web Server Configuration
The Edge One™ Web Server responds to requests necessary to display the Edge One™ web interface. It responds to internal API calls made the platform’s user interface. the configuration of:
- HTTP and HTTPS Server ports. The default HTTP port is 80. The default HTTPS port is 443. To disable a port, keep its panel blank.
The Force HTTPS switch is set to OFF by default, and can be switched ON to make sure that all communications will be secured with HTTPS. If the default values are not available in your network, you can configure these ports as required.
- SSL Certificates from an external Certification Authority. By default, the Web Server using internally generated certificates for security. This setting allows the use the use of certificates generated by your Certification Authority so that Edge One™ may become a trusted node in your internal network.
To use your own certificates, you can install the Key and Certificate using their respective Import buttons.
For the configurations to take effect, you must click on Save and Reboot which will restart the system running the Edge One™ Platform.
PLEASE NOTE:
Once these settings are changed, they are required to access the Edge One™.
Here is an image of the Web Server standard settings.
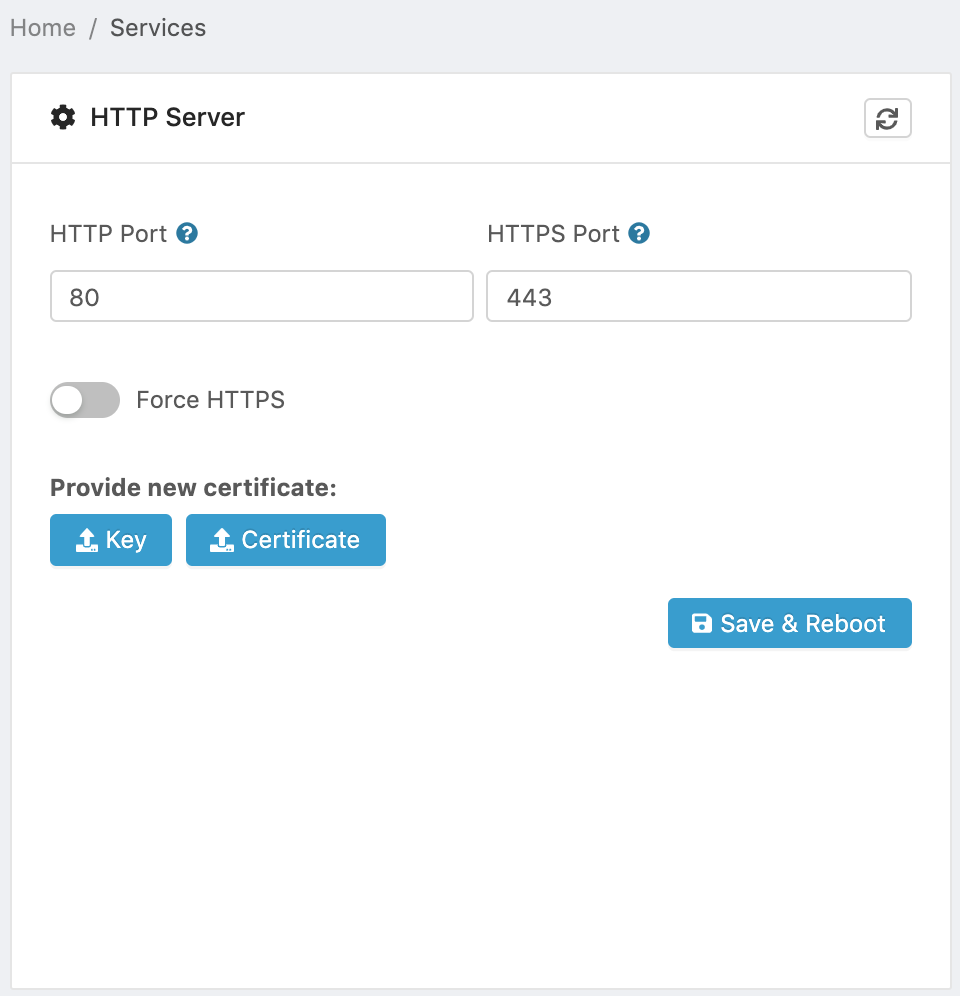
Figure 1. Edge One™ Web Server Configuration.
MQTT Broker configuration
https://www.facebook.com/carlosjoaquin.antezanavalenzuela/posts/10221633782131607# Edge One™ makes use of an MQTT message broker for all its modules communications. It supports the following four broker options:
- An Internal MQTT broker. Recommended for applications that don’t have a lot of connections and have a low data rate throughput.
- A MQTT Mosquitto broker This broker is recommended for most applications that require performance. The Edge One™ Mosquitto Broker container is available in the CloudPlugs IoT Container Registry.
- A Custom MQTT broker. When you must use an external MQTT broker.
- An ActiveMQ broker. Recommended for applications with a high message load that can benefit from a cluster of nodes.
Internal MQTT Broker
Edge One™ has a built-in MQTT message broker recommended for most applications which do not have high data throughput. You can configure the broker as follows:
- If you plan on using MQTTS, you have the option to use the HTTPS certificates from the Web Server, in which case you turn the Use HTTPS certificates switch ON.
- If you want to use an external Certification Authority, you can get your credentials from the Authority and upload the Key and the Certificate to the broker.
- Once you are done with your configuration, click on Save & Reboot. This will restart the system running Edge One™ for the changes to take effect.
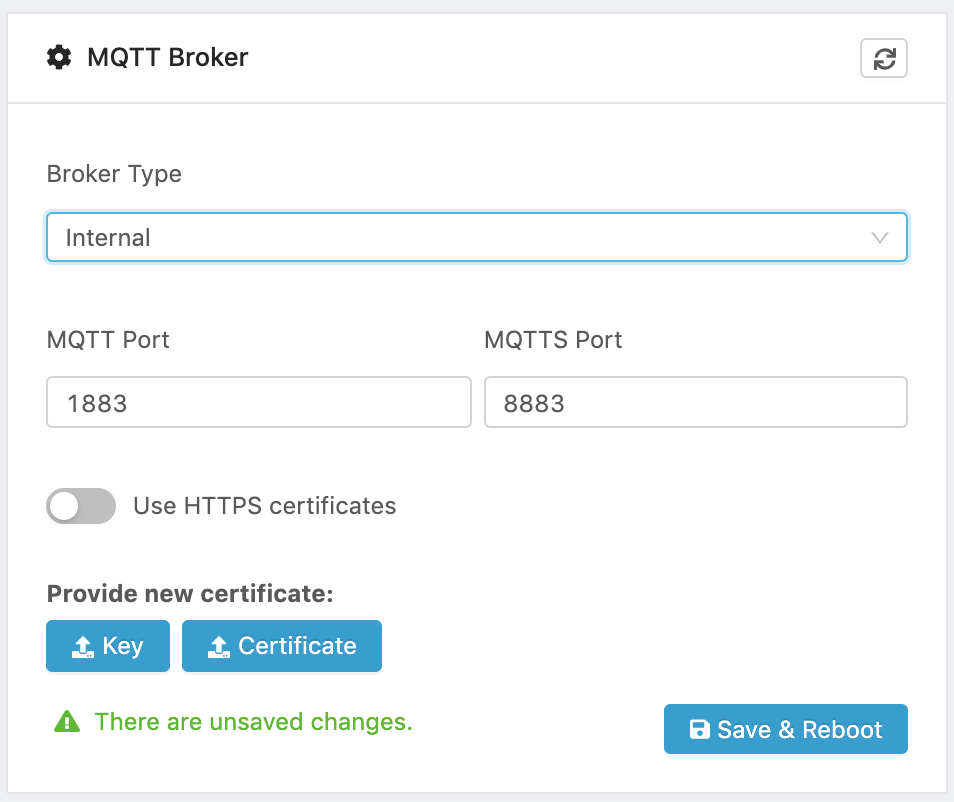
Figure 2. Internal Broker Configuration.
Mosquitto Broker
Eclipse Mosquitto is an open source (EPL/EDL licensed) message broker that implements the MQTT protocol versions 5.0, 3.1.1 and 3.1. Mosquitto is lightweight and is suitable for use on all devices from low power single board computers to full servers.
If you will be using the Edge One™ Mosquitto Broker container, you can configure the broker as follows:
- Deploy the Broker Mosquitto container appropriate for the architecture of the system running your Edge One™. Mosquitto broker containers for various system architectures are available in the Containers Registry in the web desktop of your CloudPlugs IoT account. The container must show in the Modules list under Gateway before you can use it.
To learn to deploy containers on Edge One™, refer to the Container Configuration Guide.
- If you plan on using MQTTS, you have the option to use the HTTPS certificates from the Web Server, in which case you turn the Use HTTPS certificates switch ON.
- If you are using an external Certification Authority, you can also provide a new SSL or TLS 1.2 security certificate, in which case you just need to upload the Key and the Certificate.
- Once you are done with your configuration, click on Save & Reboot.
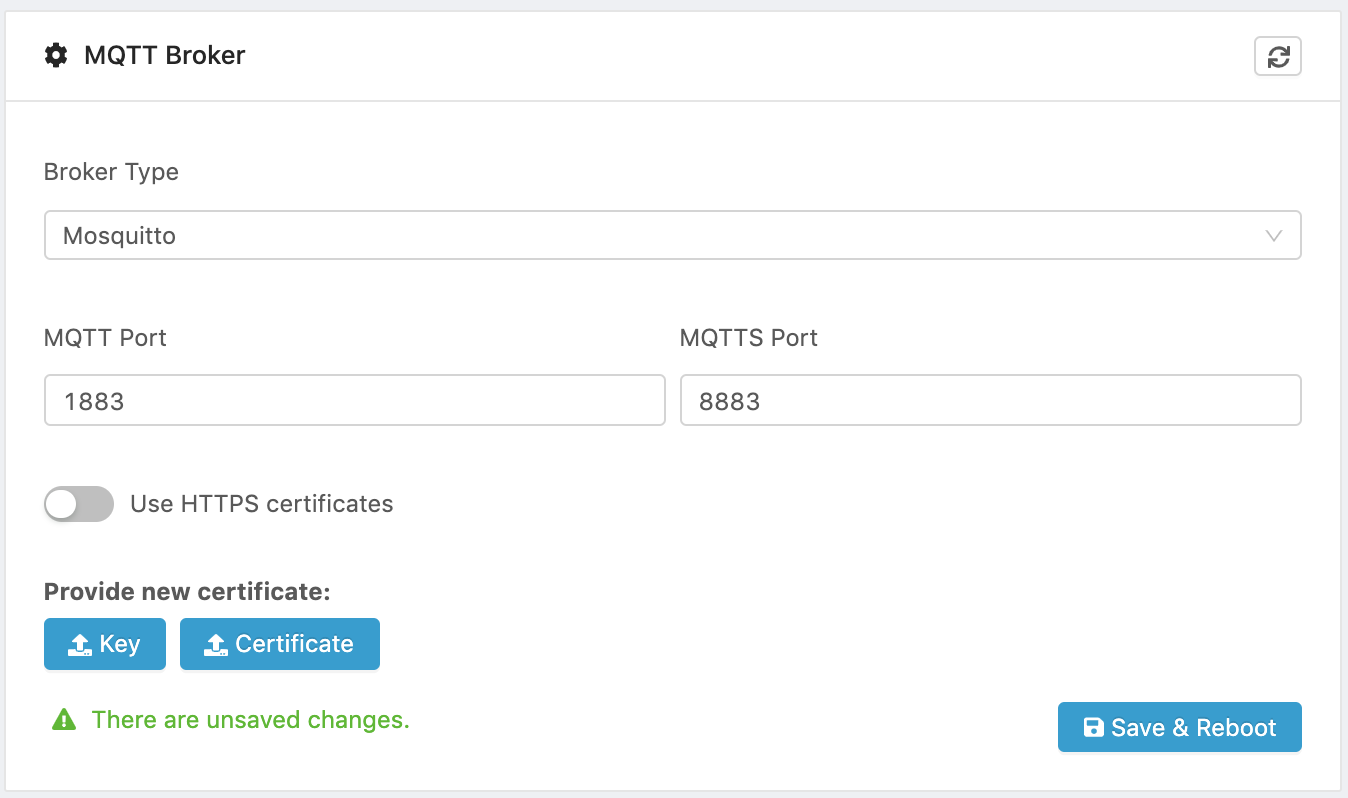
Figure 3. Mosquitto Broker Configuration.
Custom MQTT Broker
Edge One™ supports the use of external MQTT message brokers. You can configure the external broker as follows:
- Select the protocol to be used on the external broker:
- MQTT
- MQTTS. When MQTTS is selected, you can set the Skip certificates check switch to OFF to enable communications without checking certificates.
- Enter the Broker’s Host IP Address.
- Enter the Port to be used.
- Depending on the broker used, you may need to configure one of the following two options. Note that they cannot be configured simultaneously.
- Websocket communications. If this is the case:
- Enter the Websocket port.
- Enter the Websocket URI on the server.
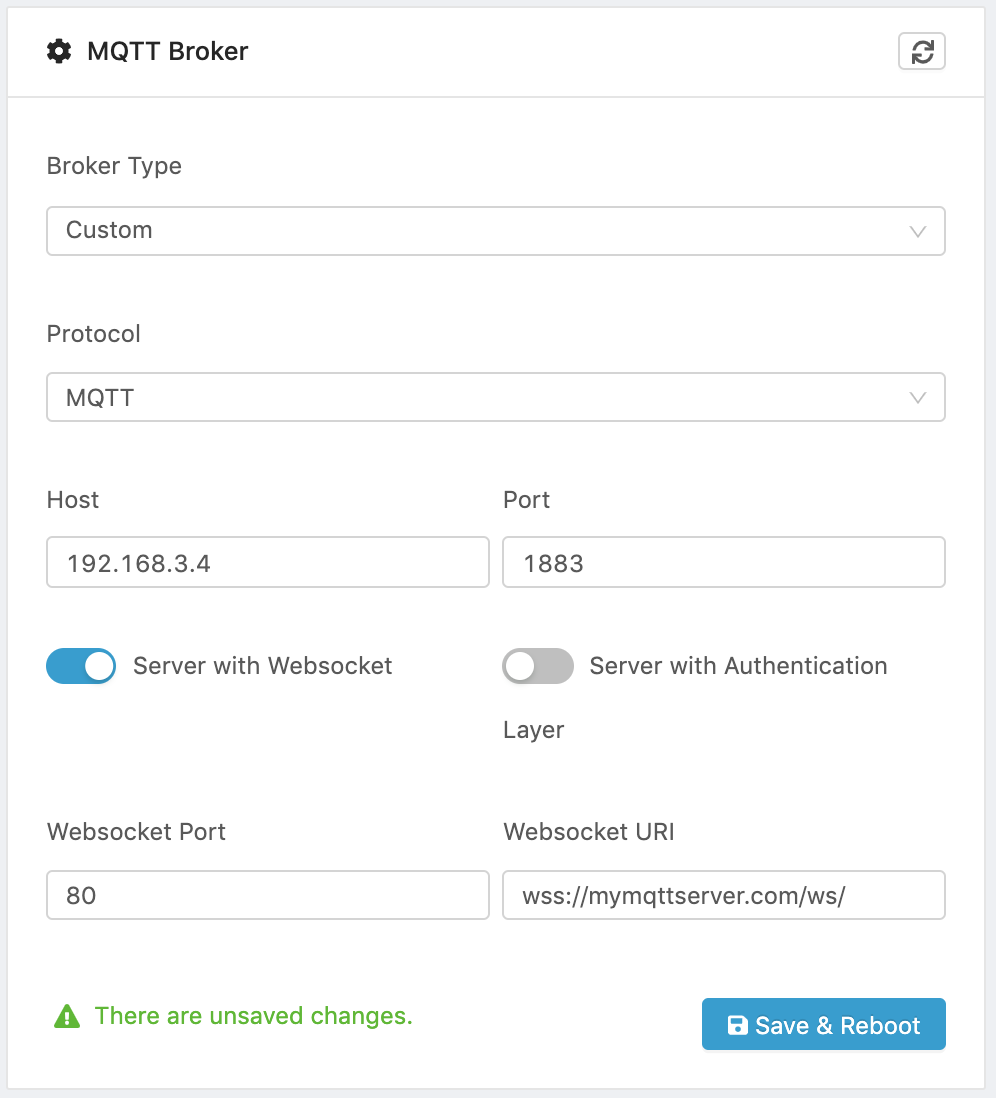
Figure 4. Broker with Websocket Communications Configuration.
- If the broker requires Authentication credentials, you need to enter the following two sets of credentials:
- Username and password for read-write communications.
- Username (read-only) and Password (read-only) for read-only communications.
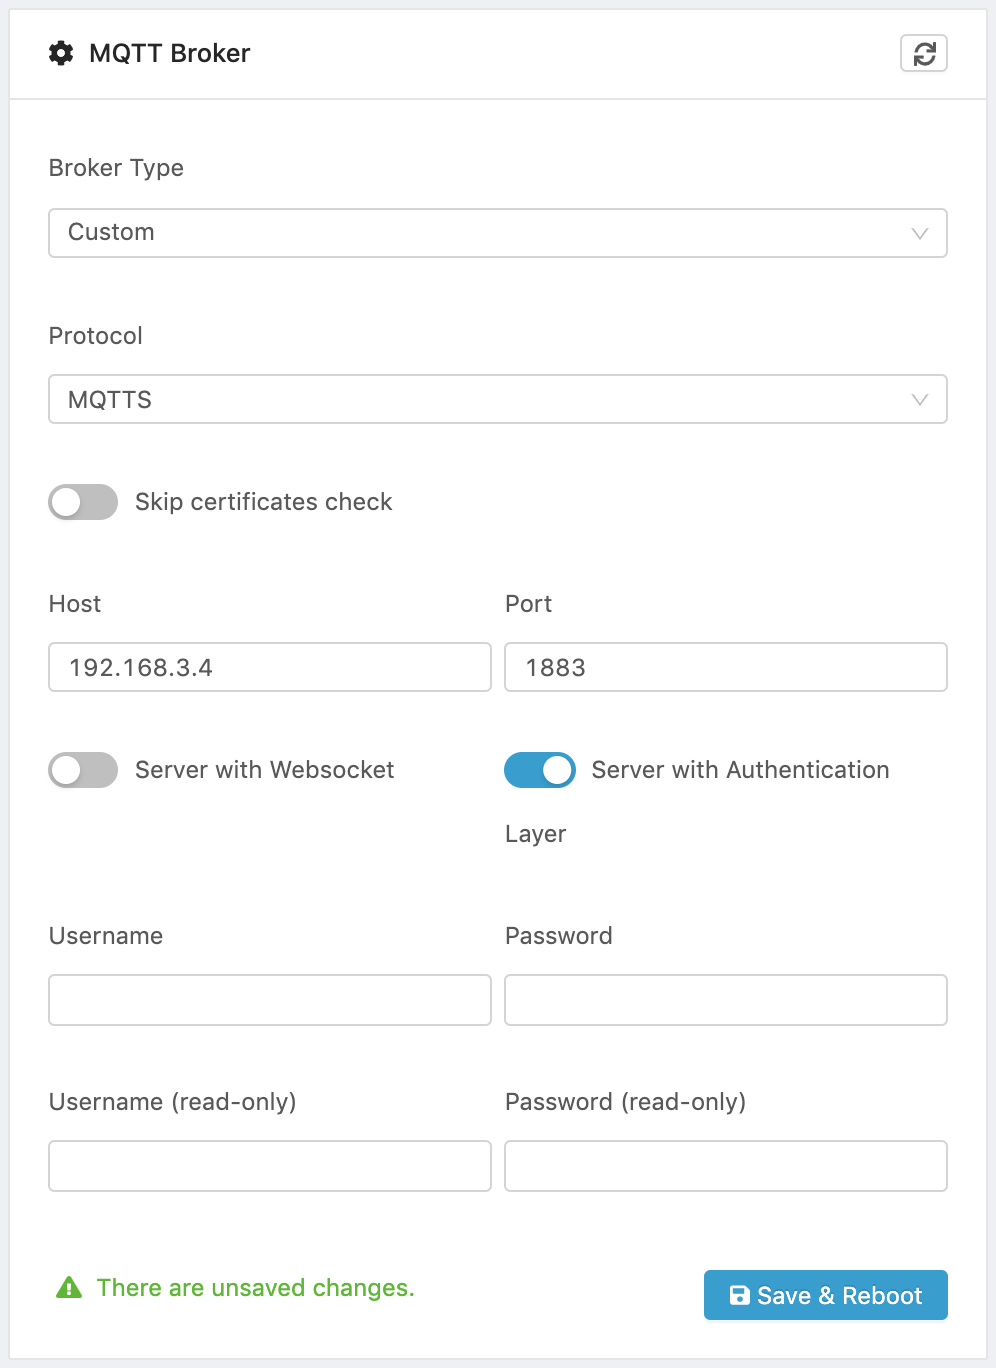
Figure 5. Broker with Authentication Credentials Configuration.
- Once you are done with your configuration, click on Save & Reboot.
Edge One™ projects and the Edge One™ core are clients and connect to the MQTT Broker using SSL or TLS, and authenticate with the usernames and passwords configured. The client figures out what type of connection
To enable more granular access to the message broker, and increase teh security of your solution, If the customer wants they can configure individual connection authentication credentials for each project.
Active MQ Broker
Apache ActiveMQ™ is the most popular open source, multi-protocol, Java-based messaging server. It supports industry standard protocols so users get the benefits of client choices across a broad range of languages and platforms. Connectivity from C, C++, Python, .Net, and more is available. Edge One™ allows you to use this messaging server as the primary server inside the platform.
Active MQ has a long established, endlessly pluggable architecture serving many generations of applications. It provides many advanced features including message load-balancing and high-availability for your data. Multiple connected “master” brokers can dynamically respond to consumer demand by moving messages between the nodes in the background. Brokers can also be paired together in a master-slave configuration so that if a master fails then the slave takes over ensuring clients can get to their important data and eliminating costly downtime. ActiveMQ ncludes the following functionality.
- JMS 1.1 with full client implementation including JNDI.
- High availability using shared storage.
- Familiar JMS-based addressing model.
- Network of brokers for distributing load.
- KahaDB & JDBC options for persistence.
If you will be using the Edge One™ ActiveMQ Broker container, you can configure the broker as follows:
- If you plan on using MQTTS, you have the option to use the HTTPS certificates from the Web Server, in which case you turn the Use HTTPS certificates switch ON.
- If you are using an external Certification Authority, you can also provide a new SSL or TLS 1.2 security certificate, in which case you just need to upload the Key and the Certificate.
- Once you are done with your configuration, click on Save & Reboot.
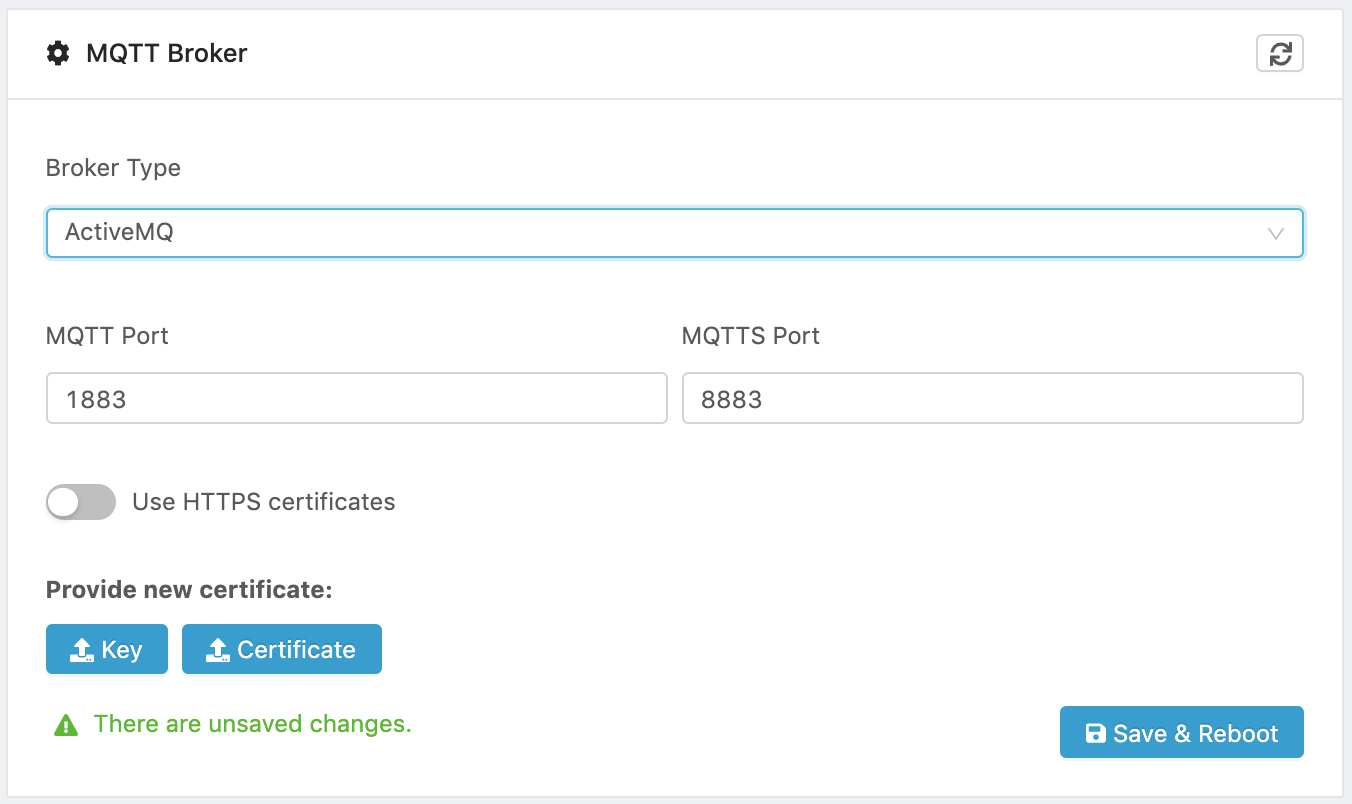
Figure 6. ActiveMQ Broker Configuration.
Datastore Server
Edge One™ supports the use of the InfluxDB datastore server packaged as a container and available in the CloudPlugs IoT Container Registry. Support for additional databases is available through the Edge One™ Datastore Connector.
InfluxDB is a high-performance data store written specifically for time series data. It allows for high throughput ingest, compression and real-time querying. It provides write and query capabilities with a command-line interface, a built-in HTTP API, a set of client libraries (e.g., Go, Java, and JavaScript) and plugins for common data formats such as Telegraf, Graphite, Collectd and OpenTSDB.
InfluxDB works with InfluxQL, a SQL-like query language for interacting with data. It has been lovingly crafted to feel familiar to those coming from other SQL or SQL-like environments while also providing features specific to storing and analyzing time series data. InfluxQL supports regular expressions, arithmetic expressions, and time series-specific functions to speed up data processing.
InfluxDB can handle millions of data points per second. Working with that much data over a long period can lead to storage concerns. InfluxDB automatically compacts data to minimize your storage space. In addition, you can easily downsample the data; keeping high-precision raw data for a limited time and storing the lower-precision, summarized data for much longer or until the end of time. InfluxDB has two features that help to automate the downsampling and data expiration processes — Continuous Queries and Retention Policies.
To use the InfluxDB datastore:
- Deploy the DataStore InfluxDB container appropriate for the architecture of the system running your Edge One™ platform. InfluxDB containers for various architectures are available in the Containers Registry in the web desktop of your CloudPlugs IoT account. The container must show in the Modules list under Gateway before you can use it.
To learn to deploy containers on Edge One™, refer to the Container Configuration Guide.
- Open the Services menu item under Settings in your Edge One™.use the Datastore Server panel under Services.
- Select Influxdb from the Datastore Server dropdown menu.
- Enter the port number used by the InfluxDB server.
- Enter the username used to access the database server.
- Enter the password used to access the database server.
- Click on Save & Reboot. This will save your setup and reboot the system used by Edge One™ for the configuration to be completed.
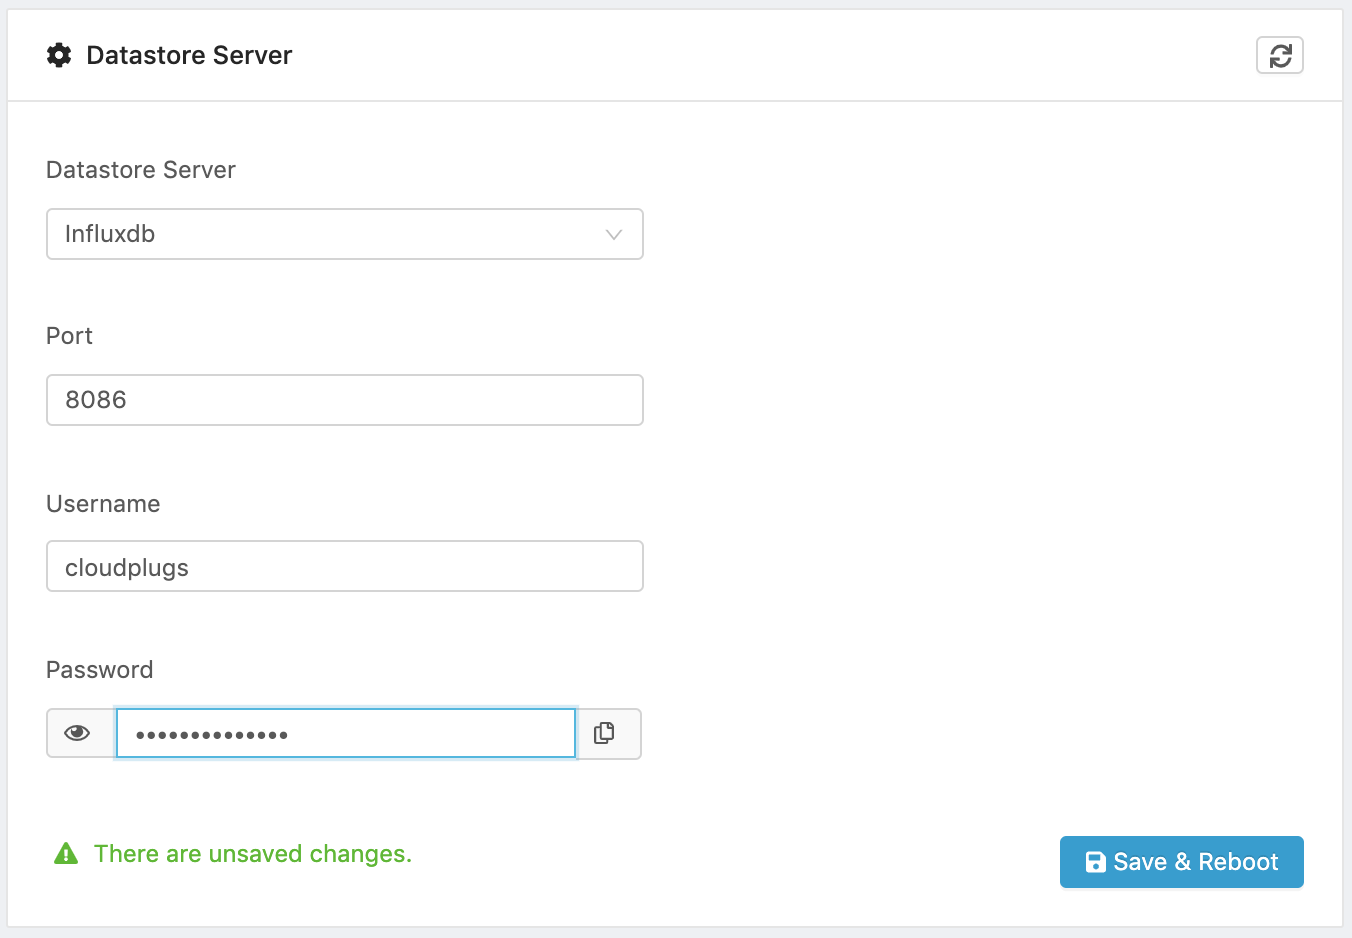
Figure 7. InfluxDB Configuration.
Data Visualizer for Database
Edge One™ also supports the use of Grafana to explore, visualize and analyze time-series data. Grafana allows you to query, visualize, alert on and understand your metrics no matter where they are stored. With Grafana you can create, explore, and share dashboards with your team and foster a data driven culture.
Grafana supports over 30 open source and commercial data sources allowing you to pull together Edge One™ project data and external data wherever it lives to build dashboards that meet the stringiest requirements.
The key features of Grafana include:
| Visualization | Fast and flexible client side graphs with a multitude of options. Panel plugins for many different way to visualize metrics and logs. |
| Dynamic Dashboards | Create dynamic & reusable dashboards with template variables that appear as dropdowns at the top of the dashboard. |
| Explore Metrics | Explore your data through ad-hoc queries and dynamic drilldown. Split view and compare different time ranges, queries and data sources side by side. |
| Explore Logs | Support for switching from metrics to logs with preserved label filters. Quickly search through all your logs or streaming them live. Works best with the Grafana Loki data source but support for more is planned. |
| Alerting | Visually define alert rules for your most important metrics. Grafana will continuously evaluate and send notifications to systems like Slack, PagerDuty, VictorOps, OpsGenie. |
| Mixed Data Sources | Mix different data sources in the same graph! You can specify a data source on a per-query basis. This works for even custom datasources. |
| Annotations | Annotate graphs with rich events from different data sources. Hover over events shows you the full event metadata and tags. |
| Ad-hoc Filters | Ad-hoc filters allow you to create new key/value filters on the fly, which are automatically applied to all queries that use that data source. |
For details on how to use and configure Grafana, please consult its documentation.
To use the Grafana connector on Edge One™:
-
Configure and run an internal datastore server such as InfluxDB or an external database configured through the Datastore Connector.
-
Deploy the Grafana Data Visualizer container for the processor architecture of the system hardware running your Edge One™. The Grafana containers for various architectures are available in the Containers Registry in the web desktop of your CloudPlugs IoT account. The container must show in the Modules list under Gateway before you can use it.
To learn to deploy containers on Edge One™, refer to the Container Configuration Guide.
- Open the Services menu item under Settings in your Edge One™.use the Datastore Server panel under Services.
- Select Grafana from the Data Visualizer panel’s dropdown menu.
- Click on Save & Reboot. This will save your setup and reboot the system used by Edge One™ for the configuration to be completed.
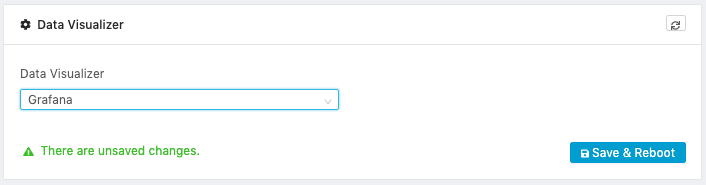
Figure 8. Grafana Configuration.
To access and configure Grafana:
- Open the Data Visualizer panel under Gateway which will open a new browser tab with the Grafana user interface.
- Configure the data source which will be either InfluxDB or a datastore configured with the Datastore Connector.
- Create your dashboard.